The crypto market has experienced a deep correction in the last two days. A downward movement from a high of $0.392 on August 17 caused Ripple to lose more than 13% of its market capitalization at the time of this writing.
Technical Analysis
By: Grizzly
The Weekly Chart
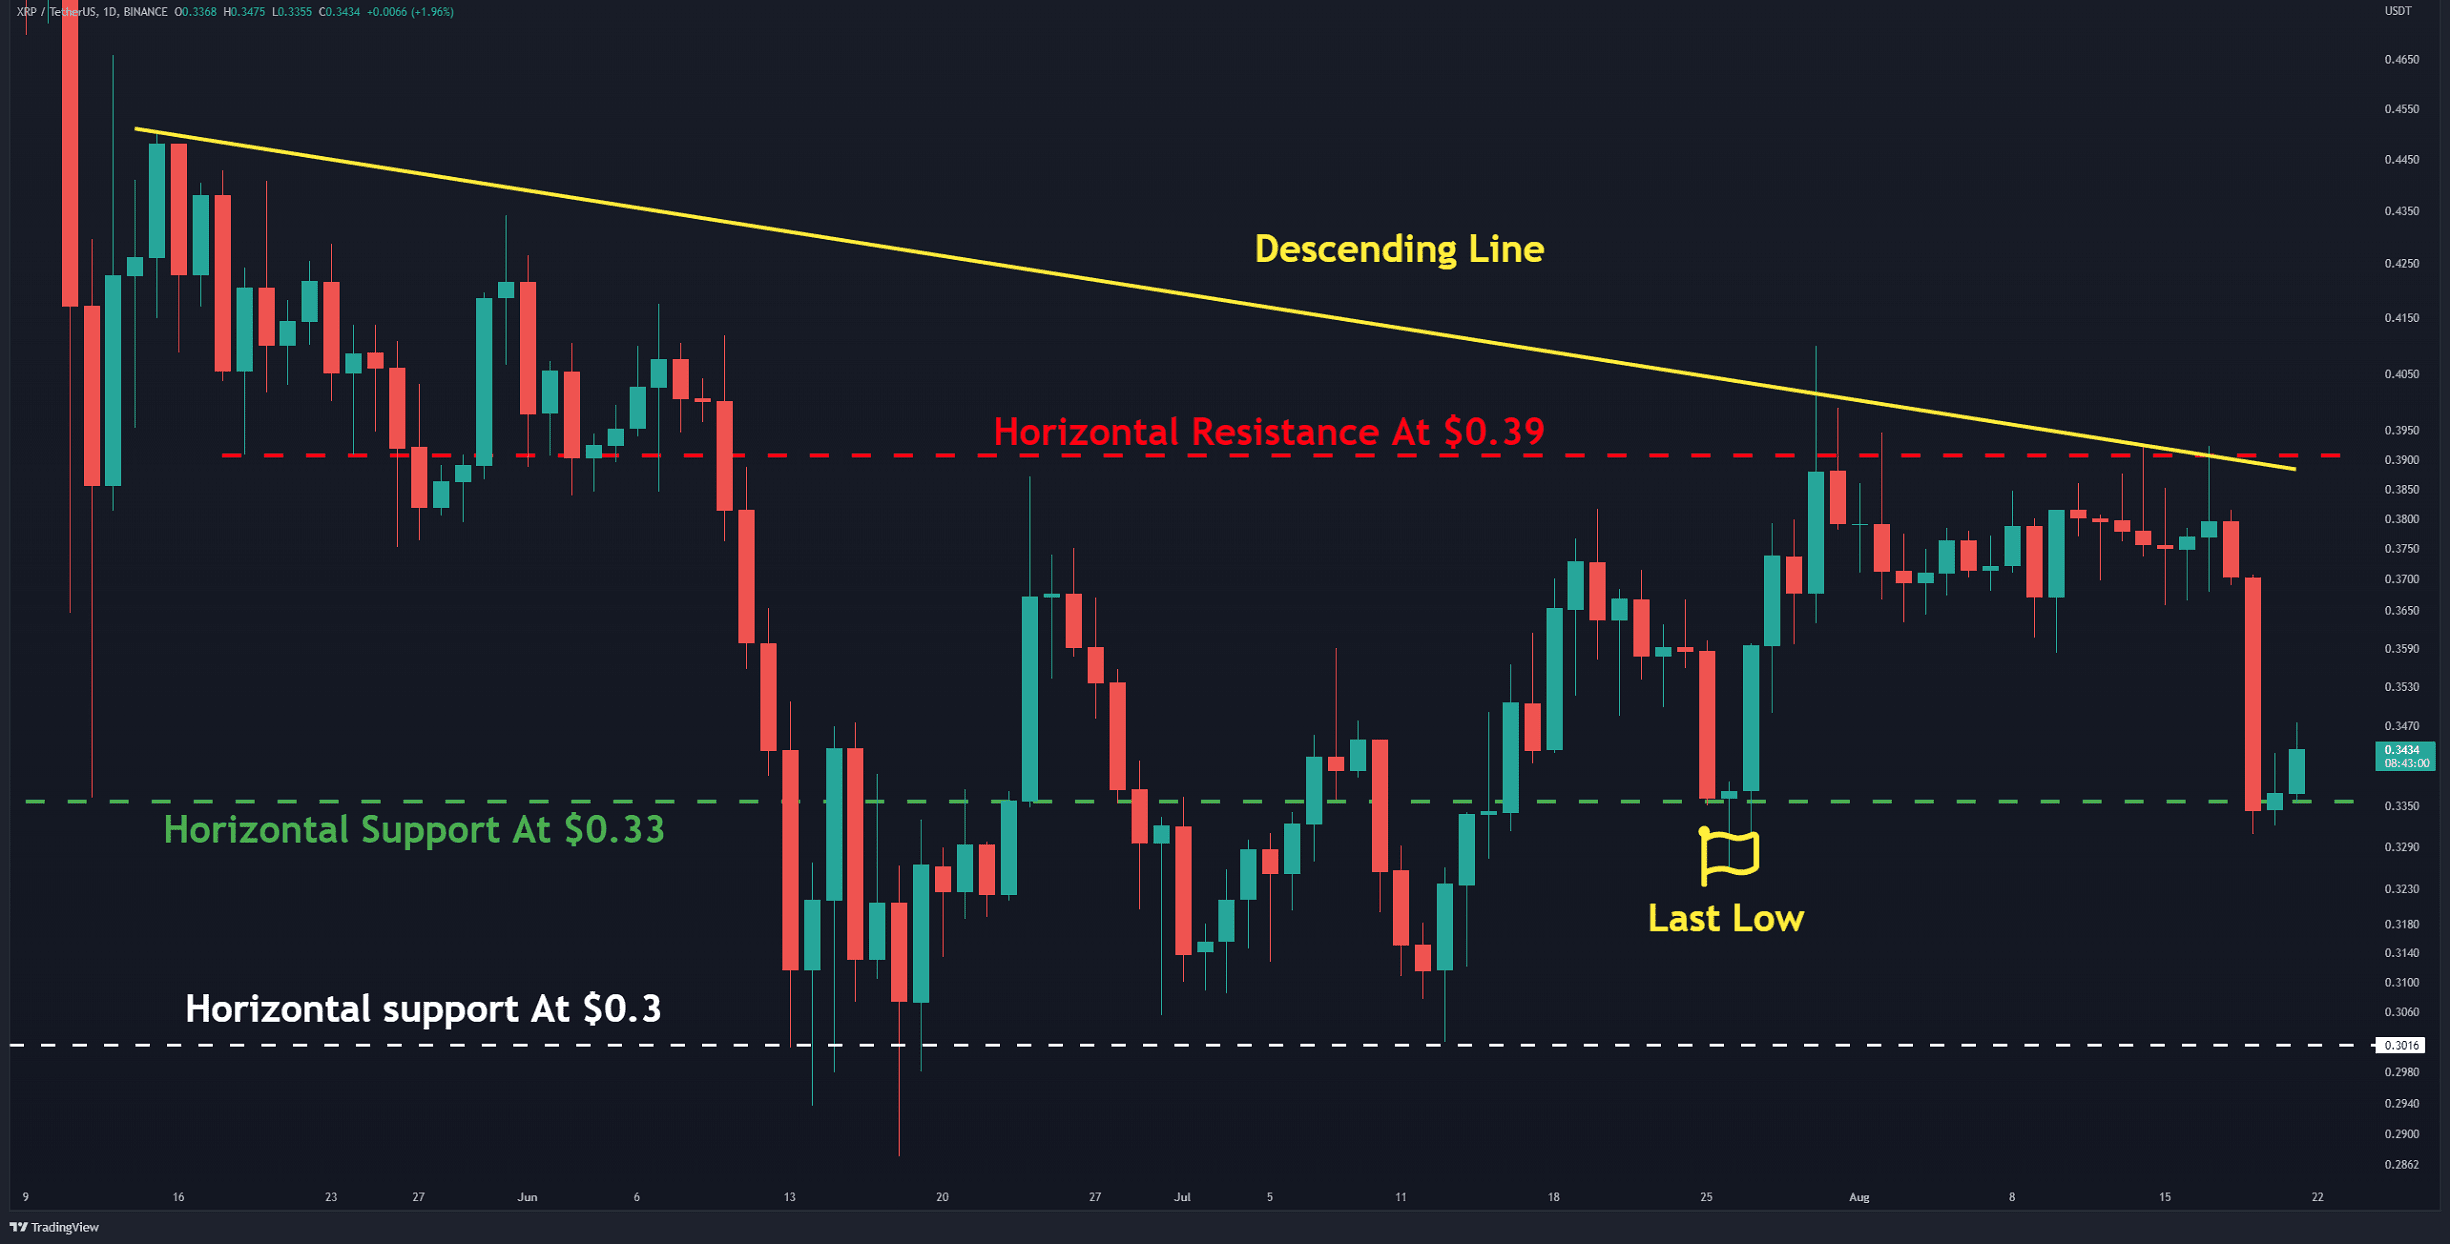
After three weeks of swinging below horizontal resistance at $0.39 (in red), the bears finally aggressively pushed the price down. This formed a giant red daily candle over the last two months. The key is that the pair has already reached support that coincides with the previous bottom. Technically, a bullish trend often reverses when a lower high and lower low appear on the chart. If the bulls fail to defend this horizontal support at 0.33 (in green), then the formation of a bearish structure is triggered. In this scenario, the next support at $0.3 (in white) will likely be retested after more than a month.
On the opposite side, unless Ripple can flip $0.39, the start of a significant bullish trend is unlikely.
A third scenario is that traders who have taken short positions book their profits. This increases the price to around $0.36, which can be considered a pullback. If the pair can close above this level, the bulls will have another chance to test the descending line resistance (in yellow).
Currently, the bears have more control over the market, and it remains to be seen if they can defeat the bulls, who are defending $0.33.
Key Support Levels: $0.33 & $0.30
Key Resistance Levels: $0.36 & $0.39
Daily Moving Averages:
MA20: $0.37
MA50: $0.35
MA100: $0.36
MA200: $0.55
The XRP/BTC Chart
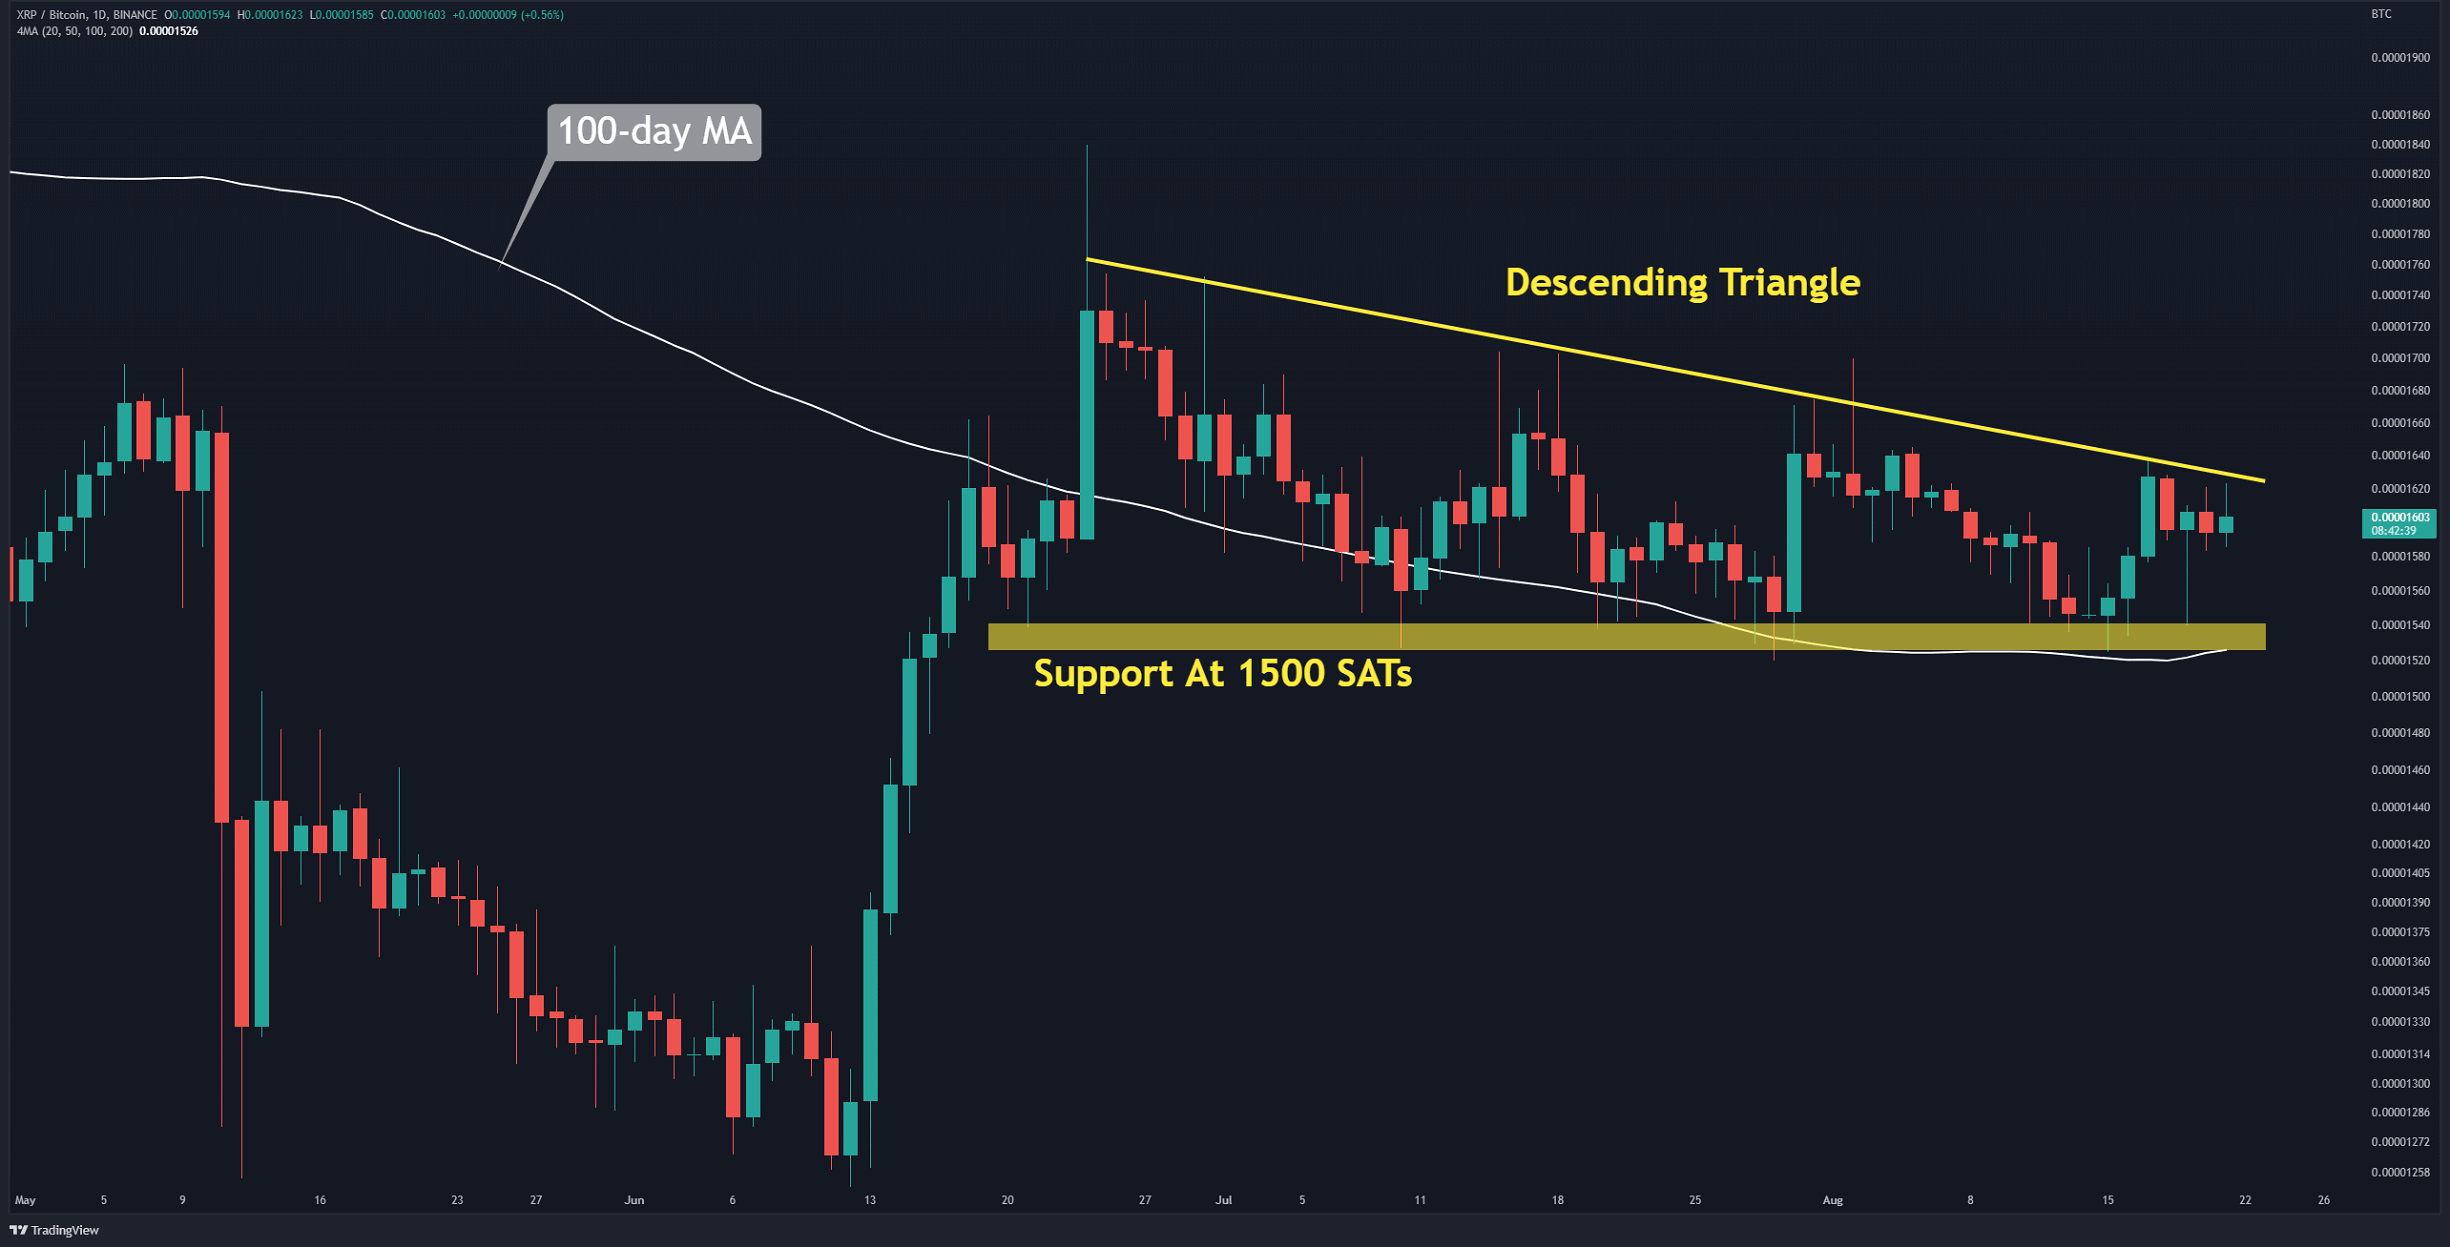
The XRP/BTC chart shows the price moving inside a descending triangle (in yellow). This pattern is often considered a bearish one. Notably, the bulls have so far powerfully defended the horizontal support at 1,500 SATs, combined with the 100-day moving average line (in white).
Suppose the buyers can break the triangle’s resistance line (above 1700 SATs). In this case, the bullish momentum will dominate the market. The target of such a move can be 2000 SATs.
Key Support Levels: 1500 SATs & 1370 SATs
Key Resistance Levels: 1700 SATs & 2100 SATs
Binance Free $100 (Exclusive): Use this link to register and receive $100 free and 10% off fees on Binance Futures first month (terms).
PrimeXBT Special Offer: Use this link to register & enter POTATO50 code to receive up to $7,000 on your deposits.
Disclaimer: Information found on CryptoPotato is those of writers quoted. It does not represent the opinions of CryptoPotato on whether to buy, sell, or hold any investments. You are advised to conduct your own research before making any investment decisions. Use provided information at your own risk. See Disclaimer for more information.
Cryptocurrency charts by TradingView.
- Bitcoin
- blockchain
- blockchain compliance
- blockchain conference
- coinbase
- coingenius
- Consensus
- crypto conference
- crypto mining
- Crypto News
- cryptocurrency
- CryptoPotato
- decentralized
- DeFi
- Digital Assets
- ethereum
- machine learning
- non fungible token
- plato
- plato ai
- Plato Data Intelligence
- Platoblockchain
- PlatoData
- platogaming
- Polygon
- proof of stake
- Ripple XRP Price
- W3
- XRP Analysis
- XRPBTC
- XRPUSD
- zephyrnet