TL;DR Breakdown
- Ripple price analysis reveals that the altcoin is gearing to retest the $1.20 level.
- Current support is found at the $1.15 mark.
- Current resistance is found at the $1.17 mark.
Ripple price analysis reveals that the altcoin is readying up to retest the $1.20 level. However, the altcoin is moving independently of the current market trend set by the king Bitcoin and the queen Ethereum. The altcoin is down by 3.3 percent in the past 24-hours and by 5.39 percent in the past seven days. The altcoin is, however, moving into a small reverse head and shoulder momentum at the type of writing. Let’s take a look at the Ripple price analysis through candlestick charts.
XRP/USD 1-day chart shows bullish momentum brewing
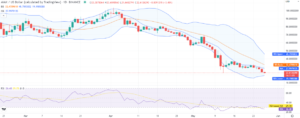
The one-day Ripple price analysis candlestick chart reveals that the altcoin is priming for bullish momentum to retest the $1.20 high. The volatility is decreasing at the time of writing compared to the past few days. The upper Bollinger band is found at the $1.36 mark, serving as the strongest resistance. The nine-day moving average is also serving as strong resistance at the $1.175 mark, showing a bearish crossover at the time of writing.

Whereas the lower Bollinger band is found at the $0.932 mark, serving as the strongest support point. The Bollinger bands’ average is at $1.14, serving as the strong support at the time of writing. The relative strength index is showing a score of 56.95, which is well below the overbought region and providing ample opportunity for bullish momentum to take place. The XRP price stands at the $1.63 mark at the time of writing.
Ripple price analysis: 4-hour chart confirms the brewing momentum
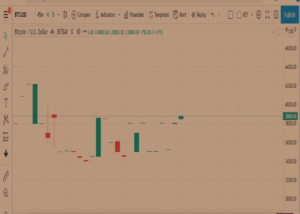
The four-hour Ripple price analysis chart reveals further confirmation for the altcoin going bullish at the time of writing. The volatility has decreased by a good margin on the four-hour candlestick chart, and the situation presents a good opportunity for buyers to pull the altcoin into the bullish momentum necessary to break past the current resistance. The upper Bollinger band is found at the $1.19 mark, serving as the strongest resistance, while the nine-day moving average (SMA 9) is found at the $1.155 mark, acting as the second resistance point.

At the time of writing, the moving average is presenting a bearish crossroad with ample support found at the $1.20 mark. The lower Bollinger band is found at the $1.06 mark serving as the strongest support point, whereas the Bollinger bands’ average is found at the $1.131 mark serving as the second strongest support below the $1.20 mark. The RSI is, however, favoring the bullish momentum to brew further, standing at the 50.56 score. An almost absolute neutral between the oversold and overbought zones, the RSI is providing more than ample opportunity for the bulls.
Ripple price analysis conclusion
Ripple is currently in a bullish brewing momentum, with the price fluctuating between the $1.14 and $1.7 marks. If the current bullish momentum uses the support to break past the resistance, XRP is likely to get past the $1.7 resistance and beyond. If the current support gives way, the altcoin is likely to drop down to the $1.10 range.
Disclaimer. The information provided is not trading advice. Cryptopolitan.com holds no liability for any investments made based on the information provided on this page. We strongly recommend independent research and/or consultation with a qualified professional before making any investment decisions.
Source: https://api.follow.it/track-rss-story-click/v3/tHfgumto13CREn16_s5ufgX50KYzL9tX
- 39
- 7
- 9
- Absolute
- advice
- Altcoin
- analysis
- bearish
- Bullish
- Bulls
- Charts
- Current
- data
- Drop
- good
- head
- High
- HTTPS
- index
- information
- investment
- Investments
- Level
- liability
- Making
- mark
- Market
- Momentum
- Opportunity
- price
- Price Analysis
- range
- research
- reverse
- Ripple
- Ripple Price Analysis
- serving
- set
- small
- support
- time
- Trading
- Volatility
- writing
- xrp
- XRP Price