Ripple Price Prediction – September 6
Our Ripple price prediction shows that XRP keeps improving as the coin is now consolidating in an intraday zone.
XRP/USD Market
Key Levels:
Resistance levels: $1.55, $1.60, $1.65
Support levels: $1.15, $1.10, $1.05

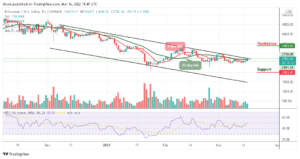
XRP/USD struggles to settle above the upper boundary of the channel amid global recovery on the cryptocurrency market. The coin asset has gained nearly 2.3% in the recent 24 hours touching the intraday high at $1.40 before retreating to $1.34. At the time of writing, the coin is floating above the 9-day and 21-day moving averages as the technical indicator Relative Strength Index (14) moves to cross above the 65-level.
Ripple Price Prediction: Ripple (XRP) Ready to Blow Hot
Looking at the daily chart above, traders can see that the red-line of 9-day MA is crossing above the green-line of 21-day MA to resume an upward movement. However, as the RSI (14) reveals, a breakout above 65-level could dictate the direction in which the Ripple price may be heading towards the upside. If the price collapses beneath the moving averages, it may turn bearish and a break above the channel could start to put the Ripple (XRP) back on the bullish footing.
However, XRP/USD needs to break above the channel and if buyers can keep the movement above this barrier, the first level of resistance is located at the resistance level of $1.45 and any further movement above this level may touch the potential resistance at $1.55, $1.60, and $1.65 levels. Should in case the market face the south, the support at $1.16 should be able to hold the bearish movement. Therefore, if the market pushes beneath, the market may turn bearish and further support levels could be reached at $1.15, $1.10, and $1.05.

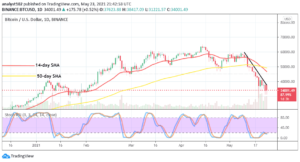
When compares with BTC, the Ripple price is hovering above the 9-day and 21-day moving averages. Meanwhile, the price action has remained intact above this barrier and if the selling pressure steps back, the coin may create a new low. At the time of writing, the RSI (14) is facing the upside, and traders may continue to see a positive move within the market.

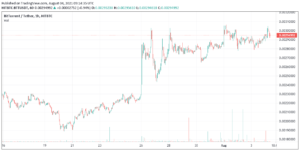
However, XRP/BTC is currently moving at 2646 SAT and traders may expect close resistance at 2700 SAT before breaking above the channel to hit the resistance level of 3000 SAT. Therefore, if the bears step into the market and break below the 9-day and 21-day moving averages; we can confirm a bearish movement for the market and the nearest support level is located at 2200 SAT and above.
Looking to buy or trade Ripple (XRP) now? Invest at eToro!
75% of retail investor accounts lose money when trading CFDs with this provider
Read more:
Source: https://insidebitcoins.com/news/ripple-price-prediction-xrp-usd-touches-1-40-resistance
- "
- Action
- asset
- bearish
- Bears
- breakout
- BTC
- Bullish
- buy
- Coin
- continue
- cryptocurrency
- cryptocurrency market
- Face
- facing
- First
- Global
- High
- hold
- HTTPS
- index
- investor
- IT
- Level
- Market
- money
- move
- moves
- prediction
- pressure
- price
- Price Prediction
- recovery
- retail
- Ripple
- Ripple (XRP)
- South
- start
- support
- support level
- Technical
- time
- touch
- trade
- Traders
- Trading
- within
- writing
- XRP/BTC
- XRP/USD