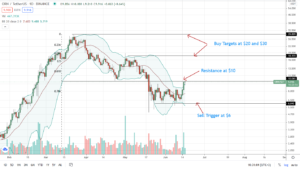
The RVN coin price jumps to retest the bearish breakout of the head and shoulder pattern in the daily chart. Therefore, a bearish continuation is possible. Ravencoin is a solution to the issue of the transfer of assets and trading through blockchain. Earlier, if a person was able to create something using the Bitcoin blockchain and it was destroyed, the asset could be destroyed accidentally by someone who traded the currency the asset was created with. As a fork of the Bitcoin algorithm, Ravencoin includes four fundamental changes: a modified issuance calendar (with the block rewards of up to 5,000 RVN) and block time cut to an hour, supply limited to 21 billion and an algorithm for mining (KAWPOW previously the X16R and X16RV2 respectively) is designed to limit that centralization that is caused due to ASIC hardware. Let us move ahead to read about RVN technical analysis. Past Performance of RVN The RVN coin price shows an increase in demand with a recent jump of up to 20% in the past week. The price jump comes after multiple long-tailed daily candles reflect a release of trapped momentum. However, the price jump might be the retest of the zone fallout at $0.08. RVN/USD Daily Chart RVN Technical Analysis The RVN coin price forms bullish engulfing candles with a jump of more than 10% in the past 48 hours. The reversal might be the retest of the head and shoulder pattern fallout in the daily chart. The crucial Simple Moving averages show a bearish crossover of the 200 and 100-day averages as the price trades significantly lower than the SMAs. Therefore, the reversal lacks the bullish commitment as sellers remain active at the falling 50-day SMA. The RSI Indicator shows a reversal in the slope from the oversold boundary as it crosses above the 14-day SMA and heads higher to the central line. Moreover, the RSI shows no significant divergence present in the price chart. The Stochastic RSI Indicator shows the K and D lines rise higher into the neutral range as it surpasses the oversold zone. Therefore, the bullish cycle shows increased chances of touching the $0.08 zone. Therefore, the technical indicators reflect a bullish reversal but the price action forecasts a reversal after retest. Hence, RVN traders need to be careful about trading strategies of the next few days. Upcoming Trend The RVN technical analysis shows a price jump to retest the breakout of the horizontal level at $0.08 in the daily chart. Therefore, a bullish continuation till a successful retest is possible. Hence, buyers need can place a target at $0.08 and mitigate their risk as the chances of reversal near the zone are incredibly high. Sellers can find entry opportunities with a reversal candle-like Doji or Hammer near the horizontal zone. At press time, TradingView maintains a bearish view for the RVN coin and gives a “SELL” signal. Technical Analysis for RVNUSD by TradingView { “interval”: “1D”, “width”: “100%”, “isTransparent”: false, “height”: “100%”, “symbol”: “RVNUSD”, “showIntervalTabs”: true, “locale”: “in”, “colorTheme”: “dark” }
The post RVN Technical Analysis: Price Jumps To Retest Zone Fallout appeared first on Cryptoknowmics-Crypto News and Media Platform.
- "
- 000
- About
- Action
- active
- algorithm
- analysis
- asic
- asset
- Assets
- bearish
- Billion
- Bitcoin
- blockchain
- breakout
- Bullish
- Calendar
- caused
- chances
- Coin
- commitment
- could
- Currency
- Demand
- destroyed
- Display
- fallout
- First
- fork
- forms
- Hardware
- head
- High
- HTTPS
- Increase
- increased
- IT
- jump
- Level
- Limited
- Line
- Media
- Mining
- Momentum
- move
- Near
- news
- opportunities
- Pattern
- performance
- present
- press
- price
- range
- Rewards
- Risk
- Sellers
- significant
- Simple
- Someone
- something
- strategies
- successful
- supply
- Target
- Technical
- Technical Analysis
- Through
- time
- Traders
- trades
- Trading
- Trading Strategies
- us
- View
- week
- WHO