Solana gained bearish momentum and traded below $20 against the US Dollar. SOL price might now struggle to recover above the $20 and $21 resistance levels.
- SOL price is showing bearish signs below the $20.50 resistance against the US Dollar.
- The price is now trading below $19.80 and the 100 simple moving average (4 hours).
- There is a major bearish trend line forming with resistance near $19.90 on the 4-hour chart of the SOL/USD pair (data source from Kraken).
- The pair could recover but upsides might be limited above $20.
Solana Price Extends Losses
This past week, Solana’s price started a fresh decline from well above $21. SOL gained bearish momentum and was able to trade below the $20.50 support.
The bears gained strength and pushed the price below the $20 support. The price is now showing bearish signs below $20, similar to Bitcoin and Ethereum. A low is formed near $18.70 and the price is now consolidating losses.
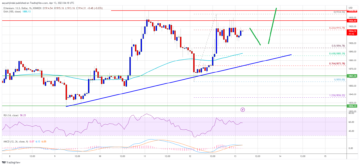
SOL is now trading below $19.80 and the 100 simple moving average (4 hours). There is also a major bearish trend line forming with resistance near $19.90 on the 4-hour chart of the SOL/USD pair. On the upside, immediate resistance is near the $19.80 level and the trend line.
The next major resistance is near the $20 zone or the 50% Fib retracement level of the downward move from the $21.51 swing high to the $18.70 low. The main resistance is now forming near the $20.50 level and the 100 simple moving average (4 hours).
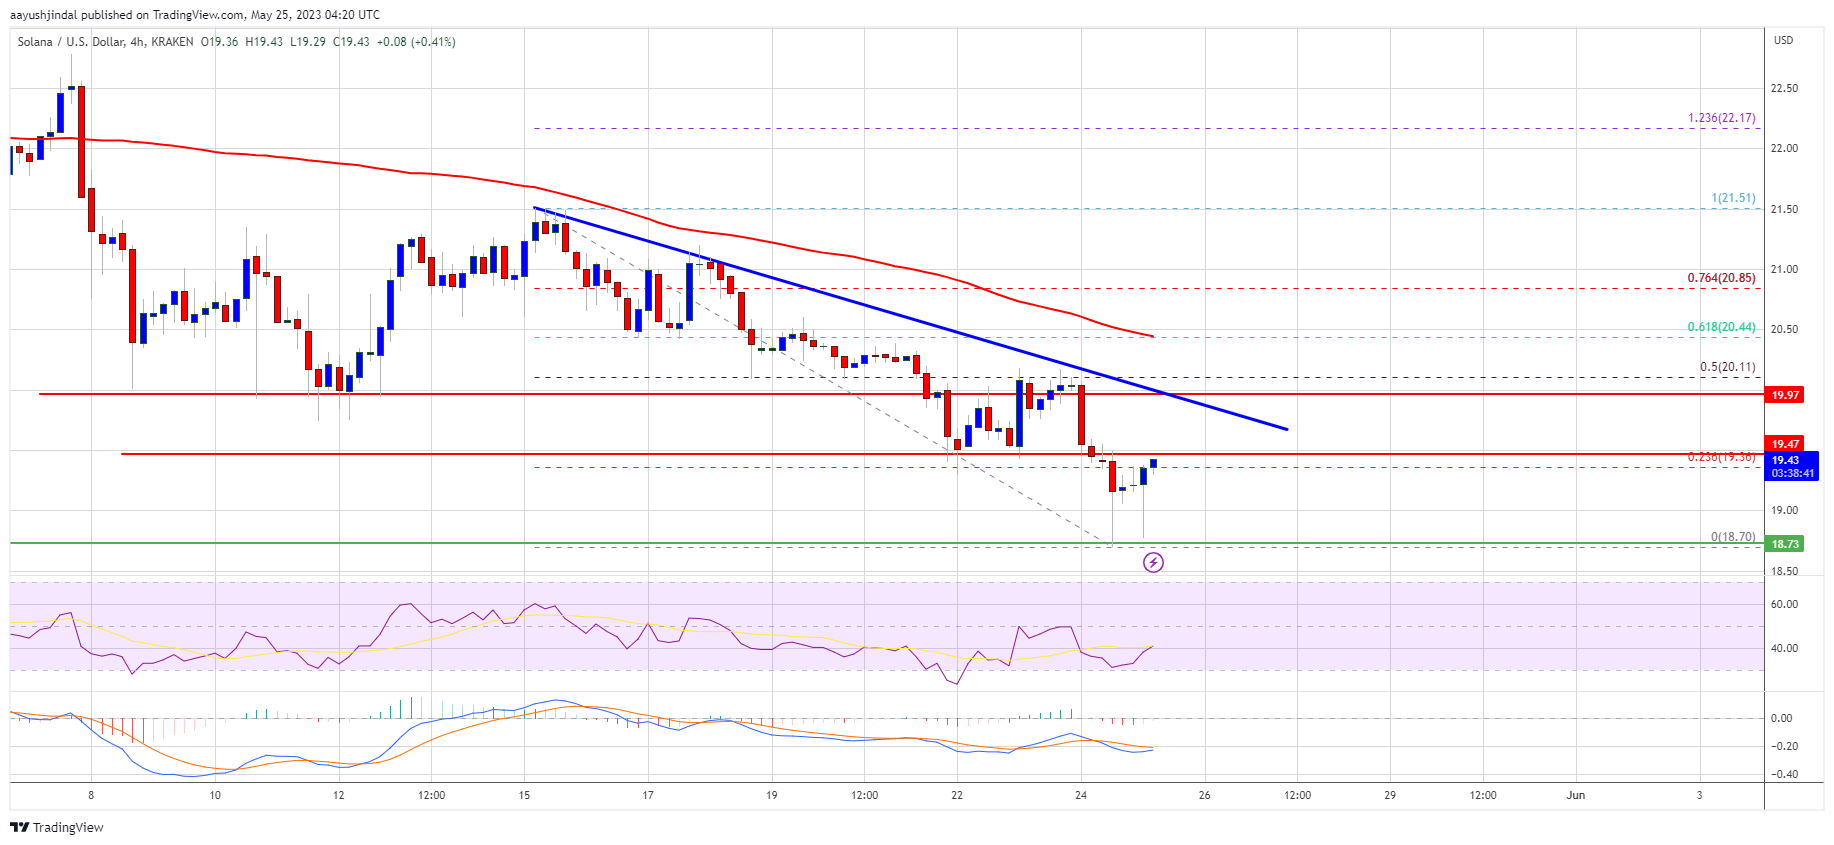
Source: SOLUSD on TradingView.com
The 61.8% Fib retracement level of the downward move from the $21.51 swing high to the $18.70 low is also near $20.50. A close above the $20.50 level could resend the price toward the $21.50 resistance zone. Any more gains might send the price toward the $22 level.
More Losses in SOL?
If SOL fails to clear the $20.50 resistance, it could continue to move down. Initial support on the downside is near the $19.00 level.
The first major support is near the $18.80 level, below which the bears might gain strength. In the stated case, Solana price may perhaps decline toward the $18.20 support. The next major support is near the $17.50 level.
Technical Indicators
4-Hours MACD – The MACD for SOL/USD is gaining pace in the bearish zone.
4-Hours RSI (Relative Strength Index) – The RSI for SOL/USD is below the 50 level.
Major Support Levels – $18.80, and $18.20.
Major Resistance Levels – $20.00, $20.50, and $21.50.
- SEO Powered Content & PR Distribution. Get Amplified Today.
- PlatoAiStream. Web3 Data Intelligence. Knowledge Amplified. Access Here.
- Minting the Future w Adryenn Ashley. Access Here.
- Buy and Sell Shares in PRE-IPO Companies with PREIPO®. Access Here.
- Source: https://www.newsbtc.com/analysis/sol-price-prediction-solana-sell-20/
- :is
- 100
- 20
- 50
- 70
- 80
- a
- Able
- above
- against
- also
- and
- any
- AS
- average
- BE
- bearish
- Bearish Momentum
- bearish signs
- Bears
- below
- breaks
- but
- case
- Chart
- clear
- Close
- consolidating
- continue
- could
- data
- Decline
- Dollar
- down
- downside
- downward
- fails
- First
- For
- formed
- fresh
- from
- Gain
- gaining
- Gains
- High
- HOURS
- HTTPS
- immediate
- in
- index
- initial
- IT
- Kraken
- Level
- levels
- Limited
- Line
- losses
- Low
- MACD
- Main
- major
- max-width
- May..
- might
- Momentum
- more
- move
- moving
- moving average
- Near
- NewsBTC
- next
- now
- of
- on
- or
- Pace
- pair
- past
- perhaps
- plato
- Plato Data Intelligence
- PlatoData
- prediction
- price
- Price Prediction
- pushed
- rallies
- Recover
- relative strength index
- Resistance
- retracement
- rsi
- sell
- send
- Signs
- similar
- Simple
- SOL
- SOL Price
- SOL/USD
- Solana
- Solana Price
- Source
- started
- stated
- strength
- Struggle
- support
- support levels
- Swing
- The
- There.
- to
- toward
- trade
- traded
- Trading
- TradingView
- Trend
- turns
- Upside
- us
- US Dollar
- was
- week
- WELL
- which
- with
- zephyrnet