- Solana begins a price discovery phase above $70, leaving the previous all-time high behind.
- Polkadot makes giant and steady steps toward $32 after closing the day above $24 support.
Bulls across the board have taken the cryptocurrency market by storm, pulling most crypto assets to achieve remarkable recovery goals. Solana is at the epitome of this bullish wave after rising to close the day above the earlier traded all-time high of $58.
On the other hand, investors believe Cardano is next in line to lift above its record high of $2.5 following the Alonzo network upgrade. Meanwhile, Bitcoin price movements are still limited to under $50,000, with $48,000 becoming the latest critical barrier.
Solana:-
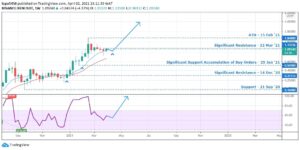
Solana has since July flown the bullish flag high above the cryptocurrency horizon without any reservations. The token extended the bullish level above $50 over the last weekend and opened trading on Monday above $60. Bulls consolidated the accrued gains at this level following a minor hurdle at $65.
However, they soon re-energized, making their way above $70 for the first time. Solana has achieved a new all-time at $75 (on Binance) but currently trading at $71.5. As its price discovery catches momentum, SOL is anticipated to close the gap to $80 in the short term.
Realize that the Moving Average Convergence Divergence (MACD) indicator has a massive bullish impulse. This comes with the sustenance of a buy signal presented in July. Moreover, as the gap between the 12-day EMA and the 26-day EMA widens, buyers gain more traction, increasing the price. Hence, it is imperative to say that Solana’s uptrend is still intact.
SOL/USDS Daily Chart

Polkadot:
Polkadot has posted impressive double-digit gains on Tuesday and still counting. The 16% growth came into the picture after DOT lifted above the previous barrier at $24. At writing, the smart contract token is dancing slightly above $26 while bulls look toward $32 (the next rendezvous).
The 200-day Simple Moving Average (SMA) caps the immediate upside, preventing the bullish leg from closing in on $28. However, as soon as this seller congestion zone is pushed into the rearview, investors can expect another majestic liftoff above $30. The area at $32 is the next key level that may act as another speed brake before DOT embarks on the Journey toward its all-time high of $50.
DOT/USD Daily Chart
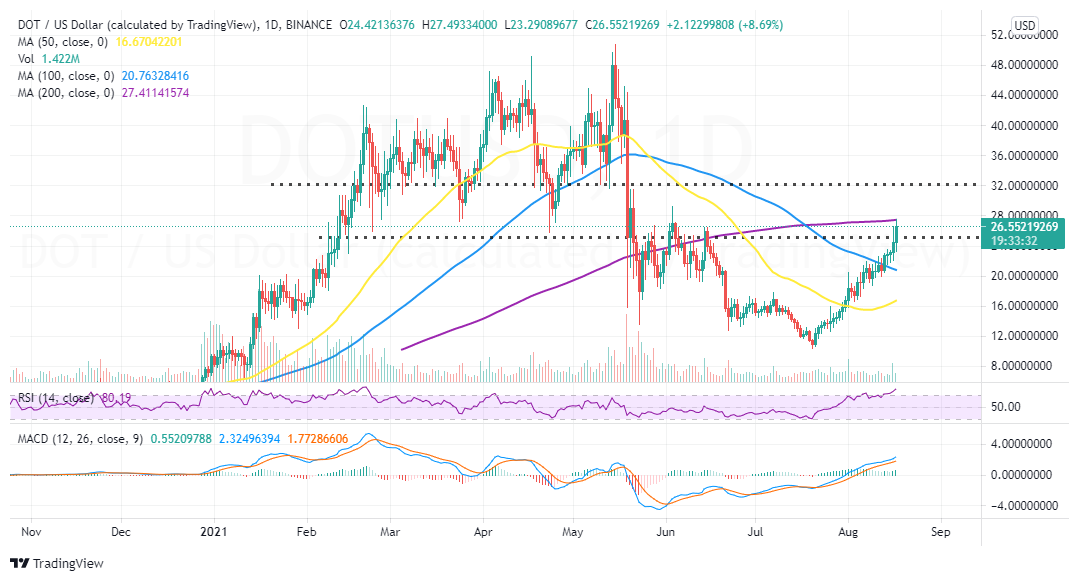
Meanwhile, the uptrend seems intact and steady enough to close the gap heading to $30. The MACD emphasizes the bullish grip at the time of writing, while the RSI confirms that buyers have the upper hand.
Subscribe to our newsletter for free

Source: https://coingape.com/solana-polkadot-price-analysis-august-16-2021/
- "
- 000
- analysis
- AREA
- Assets
- AUGUST
- binance
- board
- Bullish
- Bulls
- buy
- content
- contract
- crypto
- cryptocurrencies
- cryptocurrency
- cryptocurrency market
- day
- discovery
- EMA
- financial
- First
- first time
- gap
- Goals
- Growth
- High
- hold
- HTTPS
- investing
- Investors
- IT
- July
- Key
- latest
- Level
- Limited
- Line
- Making
- Market
- market research
- Momentum
- Monday
- network
- Newsletter
- Opinion
- Other
- picture
- preventing
- price
- Price Analysis
- pulling
- recovery
- research
- Share
- Short
- Simple
- smart
- smart contract
- Solana
- speed
- Storm
- support
- time
- token
- Trading
- Wave
- weekend
- writing