TL; DR Breakdown
- Solana began the daily price analysis chart with a positive trend.
- Solana’s price has been driven by strong bullish pressure over the past few weeks.
- We are optimistic for SOL/USD to advance higher over the next 24 hours.
Solana price analysis: General price overview
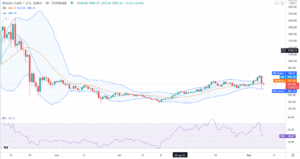
Solana began the daily price analysis chart with a positive trend. The bulls dominated the market, pushing prices up in a cup and handle pattern that sent them to intraday highs of $175.56. The bears created a strong resistance at the intraday highs, making the price to fall in a descending triangle. Several support levels were established by buyers. However, they were overcome by the powerful sellers. The bearish trend continued until the price reached its lowest point of the day, at $152, where buyers had gathered their weak force to stop the downward momentum.
Today’s Solana price analysis shows that SOL/USD is bearish. Today the coin is trading at a low of $152. This follows a successful week during which the value rose to $220 and then corrected to $170 during yesterday’s session. We expect the coin to begin an upward momentum as the bull’s eye $180 mark.
Our daily Solana price analysis shows bullish indications as the market rebounded from the lower Bollinger Band and tested $152.5 support following a bearish weekend, indicating that we are optimistic for SOL/USD to advance higher over the next 24 hours and break above another barrier at $258.

Source: Coin360
The entire cryptocurrency heat map is bleeding. The most prominent digital asset is trading in a very negative trend. The coin has recorded a more than 2 percent price decline making the coin trade a few dollars below $45K. Ether is also trading bearishly despite having positive early trading hours. One ETH trades at $3.1K. Cardano (ADA) is also bearish on the cryptocurrency heatmap, recording more than a 5 percent deviation. SOL/USD is trading in a very negative trend, recording more than 16 percent price decline.
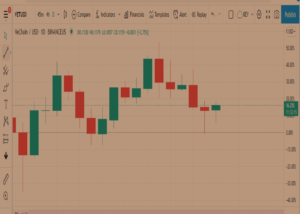
SOL/USD 4-hour chart: SOL set to retrace?

Source: Tradingview
The four-hour price analysis chart shows that the MACD line is below the red signal line, suggesting crossing over the red signal line. You’ll observe an upward trend developing that is unlikely to be halted soon if it crosses over the red signal line.
Solana’s price has been driven by solid bullish pressure over the previous few weeks, and it’s been one of the best-performing coins on several days. The bulls drove Solana to new heights of $200 during September, following a consolidation of around $80 towards the end of August.
Solana price analysis: Conclusion
Traders anticipate Solana to continue upward based on fundamentals, technicals, and historical performance. In the medium-term and long term, we expect Solana to reach $500. We believe that the price will begin a reversal for the bulls to consolidate their power before rising higher.
Disclaimer. The information provided is not trading advice. Cryptopolitan.com holds no liability for any investments made based on the information provided on this page. We strongly recommend independent research and/or consultation with a qualified professional before making any investment decisions.
Source: https://api.follow.it/track-rss-story-click/v3/tHfgumto13CZLDvNlVEs5mhamfNIiY2W
- advice
- analysis
- around
- asset
- AUGUST
- bearish
- Bears
- Bullish
- Bulls
- Coin
- Coins
- consolidation
- continue
- cryptocurrency
- data
- day
- digital
- Digital Asset
- dollars
- driven
- Early
- ETH
- Ether
- eye
- Fundamentals
- General
- HTTPS
- information
- investment
- Investments
- IT
- liability
- Line
- Long
- Making
- map
- mark
- Market
- Momentum
- Pattern
- performance
- power
- pressure
- price
- Price Analysis
- research
- Sellers
- set
- Solana
- successful
- support
- trade
- trades
- Trading
- value
- week
- weekend