- Solana price started a decent increase above the $22 resistance against the US Dollar.
- The price is now trading above $22 and the 55 simple moving average (4-hours).
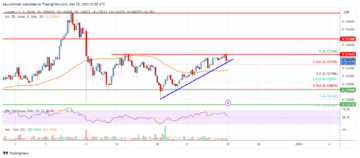
- There was a break below a major bullish trend line with support near $24.50 on the 4-hours chart of the SOL/USD pair (data feed from Coinbase).
- The pair must stay above the $23.40 and $22.60 support levels to start another increase.
Solana price is trading above $22 against the US Dollar, similar to bitcoin. SOL could is correcting lower, but it might find bids near the $23 zone.
Solana (SOL) Price Analysis
SOL price remained in a bullish zone above the $20 and $21 support levels. The bulls were active near the $20 zone. A base was formed and the price started a decent increase above the $22.00 level.
There was a steady increase above the $25.00 level and the 55 simple moving average (4-hours). The pair even climbed above the $26.50 level. A high was formed near $27.12 before there was a downside correction. The price declined below the $25 support zone.
There was a break below a major bullish trend line with support near $24.50 on the 4-hours chart of the SOL/USD pair. The price even declined below the 23.6% Fib retracement level of the upward move from the $19.75 swing low to $27.12 high.
It is now trading above $23 and the 55 simple moving average (4-hours). On the downside, an initial support is near the $23.40 level.
The 50% Fib retracement level of the upward move from the $19.75 swing low to $27.12 high is also near the $23.40 level. The next major support is near the $22.60 level. A downside break below the $22.60 support level might spark a sharp decline.
In the stated case, the price may perhaps decline towards the $20.50 level. Any more losses might call for a test of $20.00. On the upside, an immediate resistance is near the $24.50 level.
The next major resistance is near the $25.20 zone. Any more gains might send sol price towards the $27.20 resistance zone, above which the price could accelerate higher. The next major resistance sits near the $30 level.

Solana (SOL) Price
Looking at the chart, solana price is clearly trading above $22 and the 55 simple moving average (4-hours). Overall, the price must stay above the $23.40 and $22.60 support levels to start another increase.
Technical Indicators
4 hours MACD – The MACD is now losing momentum in the bullish zone.
4 hours RSI (Relative Strength Index) – The RSI is now below the 50 level.
Key Support Levels – $23.40 and $22.60.
Key Resistance Levels – $24.50, $25.20 and $27.20.
- SEO Powered Content & PR Distribution. Get Amplified Today.
- Platoblockchain. Web3 Metaverse Intelligence. Knowledge Amplified. Access Here.
- Source: https://www.livebitcoinnews.com/solana-sol-price-analysis-this-support-might-trigger-fresh-increase/
- a
- above
- accelerate
- active
- against
- analysis
- and
- Another
- average
- base
- before
- below
- Break
- Bullish
- Bulls
- call
- case
- Chart
- clearly
- Climbed
- coinbase
- comments
- could
- data
- Decline
- Dollar
- downside
- Even
- Find
- follow
- formed
- fresh
- fresh increase
- from
- Gains
- High
- higher
- HOURS
- HTTPS
- immediate
- in
- Increase
- index
- initial
- internal
- IT
- Level
- levels
- Line
- losing
- losses
- Low
- MACD
- major
- might
- Momentum
- more
- move
- moving
- moving average
- Near
- next
- overall
- perhaps
- plato
- Plato Data Intelligence
- PlatoData
- Post
- price
- Price Analysis
- relative strength index
- remained
- Resistance
- retracement
- rsi
- sharp
- similar
- Simple
- SOL
- SOL Price
- SOL/USD
- Solana
- Solana (SOL)
- Solana (SOL) Price
- Solana Price
- Spark
- start
- started
- stated
- stay
- steady
- strength
- support
- support level
- support levels
- TAG
- test
- The
- to
- towards
- Trading
- TradingView
- Trend
- trigger
- Upside
- upward
- us
- US Dollar
- which
- zephyrnet