- Stellar lumen price declined below the $0.2750 support zone against the US Dollar.
- XLM price is now trading below $0.2650 and the 55 simple moving average (4-hours).
- There is a key contracting triangle forming with resistance near $0.2620 on the 4-hours chart (data feed via Kraken).
- The pair could start a steady upward move if there is a clear break above $0.2650.
Stellar lumen price is trading in a bearish zone below $0.2800 against the US Dollar, similar to bitcoin. XLM price must settle above $0.2650 to start a fresh increase.
Stellar Lumen Price Analysis (XLM to USD)
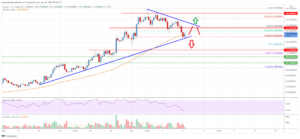
After struggling to clear the $0.2920 resistance, stellar lumen price started a fresh decline against the US Dollar. The XLM/USD pair traded below the $0.2850 support level to move into a bearish zone.
There was a break below the $0.2720 support level and the 55 simple moving average (4-hours). The price traded below the 50% Fibonacci retracement level of the upward move from the $0.2317 swing low to $0.2913 high.
It is now consolidating near the $0.2550 support zone. It is near the 61.8% Fibonacci retracement level of the upward move from the $0.2317 swing low to $0.2913 high. There is also a key contracting triangle forming with resistance near $0.2620 on the 4-hours chart.
An immediate resistance on the upside is near the $0.2620 level. The next major resistance is now near $0.2650. If there is a clear break above the $0.2650 resistance zone, the price could start another steady increase.
The next key resistance is near the $0.3000 level, above which the price could rise towards the $0.3320 level in the near term. An immediate support is near the $0.2550 level. The main support is near $0.2420. A downside break below the $0.2420 support might call for more losses. The next major support is near the $0.2120 zone. Any more losses might send the price towards the $0.2000 level.

Stellar Lumen (XLM) Price
The chart indicates that XLM price is now trading below $0.2750 and the 55 simple moving average (4-hours). Overall, the price could start a steady upward move if there is a clear break above $0.2650.
Technical Indicators
4 hours MACD – The MACD for XLM/USD is slowly gaining momentum in the bearish zone.
4 hours RSI – The RSI for XLM/USD is now below the 50 level.
Key Support Levels – $0.2550 and $0.2420.
Key Resistance Levels – $0.2620, $0.2650 and $0.3000.
The post Stellar Lumen (XLM) Price Remains at Risk of More Downsides appeared first on Live Bitcoin News.
Source: https://www.livebitcoinnews.com/stellar-lumen-xlm-price-remains-at-risk-of-more-downsides-3/