Bitcoin started an upside correction from the $18,223 low against the US Dollar. BTC climbed above $19,000, but it is now facing resistance near the 100 hourly SMA.
- Bitcoin traded as low as $18,223 before it started an upside correction.
- The price is still trading below $20,000 and the 100 hourly simple moving average.
- There is a key bearish trend line forming with resistance near $19,650 on the hourly chart of the BTC/USD pair (data feed from Kraken).
- The pair must clear the trend line and the 100 hourly SMA to continue higher towards $20,500.
Bitcoin Price Recovers Above $19,000
Bitcoin price extended losses after it settled below the $19,000 level. BTC broke the $18,500 support zone and traded as low as $18,223.
There was no test of the $18,000 zone and the price started an upside correction. There was a steady increase above the $18,500 and $18,800 levels. The price was able to clear the 50% Fib retracement level of the downward move from the $20,198 swing high to $18,223 low.
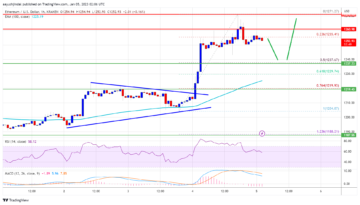
Bitcoin price even spiked above the $19,500 resistance zone. However, the bears were active near the $19,600 level and the 100 hourly simple moving average.
There is also a key bearish trend line forming with resistance near $19,650 on the hourly chart of the BTC/USD pair. The trend line is near the 76.4% Fib retracement level of the downward move from the $20,198 swing high to $18,223 low.
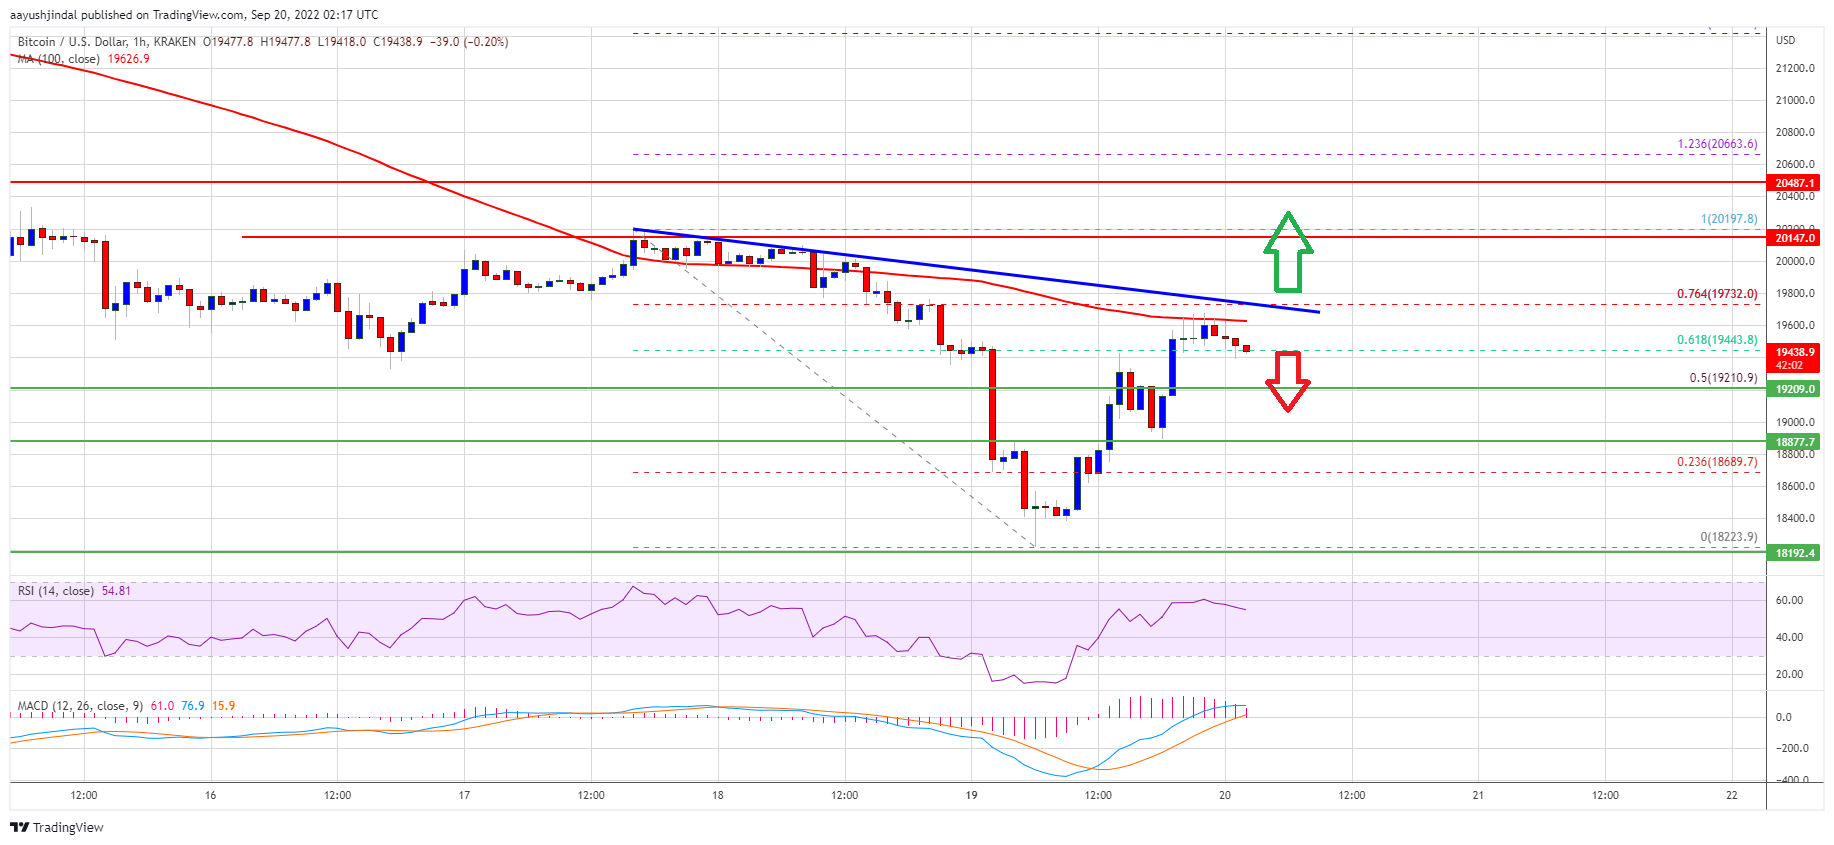
Source: BTCUSD on TradingView.com
On the upside, an immediate resistance is near the $19,600 level and the trend line. The next major resistance sits near the $20,000 level. Any more gains might send the price towards the $20,500 resistance zone. Furthermore, if the bulls remain in action, the price could test $21,200.
Fresh Decline in BTC?
If bitcoin fails to continue higher above the $19,600 resistance zone, it could start a fresh decline. An immediate support on the downside is near the $19,200 zone.
The next major support is near the $18,850 level. A clear move below the $18,850 and $18,800 levels might open the doors for a move towards the $18,223 low or even to a new low.
Technical indicators:
Hourly MACD – The MACD is now losing pace in the bullish zone.
Hourly RSI (Relative Strength Index) – The RSI for BTC/USD is now above the 50 level.
Major Support Levels – $19,200, followed by $18,850.
Major Resistance Levels – $19,600, $19,650 and $20,500.
- Bitcoin
- blockchain
- blockchain compliance
- blockchain conference
- BTC
- BTCUSD
- BTCUSDT
- coinbase
- coingenius
- Consensus
- crypto conference
- crypto mining
- cryptocurrency
- decentralized
- DeFi
- Digital Assets
- ethereum
- machine learning
- NewsBTC
- non fungible token
- plato
- plato ai
- Plato Data Intelligence
- Platoblockchain
- PlatoData
- platogaming
- Polygon
- proof of stake
- W3
- xbtusd
- zephyrnet