Disclaimer: The findings of the following analysis are the sole opinions of the writer and should not be considered investment advice
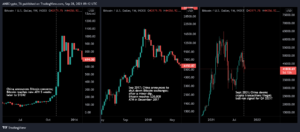
Since its ATH on 6 November, Solana (SOL) has fallen in a descending channel (yellow) over the last three months. During this phase, the 20 EMA (red) assumed strong resistance.
Now that SOL has witnessed a bearish flag, it is bracing itself for a possible retest of the $85-zone support after a phase of low volatility near the $97-mark. At press time, SOL was trading at $96.425, up by 1.1% in the last 24 hours.
Solana Daily Chart

Source: TradingView, SOL/USD
The recent bearish phase saw a nearly 63% retracement as it pierced through vital price points and formed two bearish flags in the last three months. As a result, the price action fell below its 200 EMA (green), depicting a possible start of a long-term downtrend. To top it up, bears flipped the $97-mark from support to immediate resistance.
As it fell in a down-channel, it lost the crucial 11-month-long trendline (previous support) and continued its bearish drift. However, the buyers seemingly stepped in at the five-month-long trendline support (yellow). Thus, SOL showed a promising 48% revival from its five-month low on 24 January as it reversed from the upper trendline of the down-channel.
Over the past three days, the alt also saw bearish engulfing candlesticks as it broke out of the rising wedge. This trajectory depicted a strong bear move.
From here on, SOL is eyeing a retest of its immediate resistance before testing the $85-support that coincides with its five-month trendline support. Also, as the price is not overstretched from its 20 EMA, the chances of downward movement become higher in the days to come. Should the bears dwindle, the bulls could invalidate the bearish tendencies. But, that would most likely be short-lived due to the lack of strength in their volumes.
Rationale

Source: TradingView, SOL/USD
The RSI formed a bearish divergence (cyan) with the price as it plunged towards the 36-mark over the last few days. Its sideways tendency could justify a consolidation phase before a possible fallout.
Furthermore, the Squeeze Momentum Indicator also entered a low volatility phase. Now, investors/traders should keep a close eye on the $97-mark. Any close above it would propel a near-term recovery before a likely pullback.
Conclusion
A compelling close above the $97-$100 range is needed to invalidate the already existent bearish tendencies. With the bears deploying constant pressure, SOL is looking to retest its five-month trendline support before picking itself up.
Besides, considering the impact of the broader sentiment would be vital to making a profitable move.
- Action
- already
- analysis
- ATH
- bearish
- Bears
- before
- Bulls
- chances
- compelling
- consolidation
- could
- crucial
- deploying
- during
- EMA
- eye
- fallout
- following
- Green
- here
- HTTPS
- Impact
- investment
- IT
- January
- looking
- Making
- Momentum
- months
- most
- move
- movement
- Near
- needed
- Opinions
- phase
- press
- pressure
- price
- profitable
- range
- recovery
- sentiment
- Solana
- start
- strong
- support
- Testing
- Through
- time
- top
- Trading
- trajectory
- Volatility
- What
- would
- writer