Uniswap lost traction and fell nearly 3% on Tuesday. The bearish trendline acts as a resistance hurdle near the high of $9.68. However, the momentum oscillator still holds the bullish bias for the token.
After starting the week on a high note, the Uniswap was not able to defend the gains on Tuesday. The price trades with a negative sentiment below $9.40.
Generally, the crypto market is trading with a mixed mood. As of writing, Uniswap is exchanging hands at $9.37, down 3.78% for the day. The 24-hour trading volume fell to $295,461,965, per CoinMarketCap.
Uniswap Trades Near the Bearish Trendline
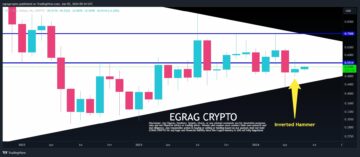
On the daily technical chart, the bulls find it difficult to cross over the bearish trend line that extends from the high of $17.33 made on March 6. After making a strong move on Monday, the prices took a breather, trading in a range bound manner for the past two sessions. However, the price still holds in the upper trajectory.

Following the moving average crossover involving the 21-day EMA and 55-day EMA on April 12, the bears enjoyed a downturn rally and the price corrected 50% in a sharp movement. Afterward, UNI entered a short-term consolidation between $6.55 and $8.13. On Monday, the bulls harnessed the strength to burst above this level.
Currently, the token trades near the critical level around $9.40 as this zone previously acted as support zone. Further, a breach of the bearish trend line would strengthen the probability of the upside breakout sustainability. If that happens, the first upside target could be found near the horizontal resistance zone at $11.43, followed by the high of March 31 at $13.33.
The bullish view is supported by the Moving Average Convergence Divergence (MACD) indicator, which trades above the central line with a bullish momentum. Additionally, Uniswap manages to uphold above the two moving averages.
– Advertisement –
Conversely, a change in the bearish sentiment could result in the more downside in the token. The first support emerges at the 55-day EMA at $8.54. If the selling intensifies in that case the low of the candlestick made on Monday could be tested at $$7.62.
Disclaimer: This content is informational and should not be considered financial advice. The views expressed in this article may include the author’s personal opinions and do not reflect The Crypto Basic’s opinion. Readers are encouraged to do thorough research before making any investment decisions. The Crypto Basic is not responsible for any financial losses.
-Advertisement-
- SEO Powered Content & PR Distribution. Get Amplified Today.
- PlatoData.Network Vertical Generative Ai. Empower Yourself. Access Here.
- PlatoAiStream. Web3 Intelligence. Knowledge Amplified. Access Here.
- PlatoESG. Carbon, CleanTech, Energy, Environment, Solar, Waste Management. Access Here.
- PlatoHealth. Biotech and Clinical Trials Intelligence. Access Here.
- Source: https://thecryptobasic.com/2024/05/22/uniswap-retreats-after-testing-the-high-of-9-68-is-10-50-still-possible/?utm_source=rss&utm_medium=rss&utm_campaign=uniswap-retreats-after-testing-the-high-of-9-68-is-10-50-still-possible
- :is
- :not
- 10
- 12
- 13
- 31
- 33
- 37
- 40
- 50
- 54
- 55
- 6
- 62
- a
- Able
- above
- acts
- Additionally
- Advertisement
- advice
- After
- and
- any
- April
- ARE
- around
- article
- AS
- At
- author
- average
- basic
- BE
- bearish
- Bears
- before
- below
- between
- bias
- bound
- breach
- breakout
- Bullish
- Bulls
- by
- case
- central
- change
- Chart
- CoinMarketCap
- considered
- consolidation
- content
- Convergence
- corrected
- could
- critical
- Cross
- crypto
- Crypto Market
- daily
- day
- decisions
- defend
- difficult
- Divergence
- do
- down
- downside
- DOWNTURN
- EMA
- emerges
- encouraged
- enjoyed
- entered
- Ether (ETH)
- exchanging
- expressed
- extends
- financial
- financial advice
- Find
- First
- followed
- For
- found
- from
- further
- Gains
- Hands
- happens
- High
- holds
- Horizontal
- However
- HTTPS
- hurdle
- ID
- if
- in
- include
- Indicator
- Informational
- Intensifies
- investment
- involving
- IT
- Level
- Line
- losses
- lost
- Low
- MACD
- made
- Making
- manages
- manner
- March
- Market
- max-width
- May..
- mixed
- Momentum
- Monday
- mood
- more
- move
- movement
- moving
- moving average
- moving averages
- Near
- nearly
- negative
- note
- of
- on
- Opinion
- Opinions
- over
- past
- per
- personal
- plato
- Plato Data Intelligence
- PlatoData
- possible
- previously
- price
- Prices
- probability
- rally
- range
- readers
- reflect
- research
- Resistance
- responsible
- result
- s
- Selling
- sentiment
- sessions
- sharp
- short-term
- should
- Starting
- Still
- strength
- Strengthen
- strong
- support
- Supported
- Sustainability
- TAG
- Target
- Technical
- tested
- Testing
- that
- The
- The Crypto Basic
- this
- thorough
- to
- token
- took
- traction
- trades
- Trading
- trading volume
- trajectory
- Trend
- Tuesday
- two
- UNI
- Uniswap
- Uphold
- Upside
- View
- views
- volume
- was
- week
- which
- with
- would
- writing
- zephyrnet
- zone