US S&P Global Composite PMI declined to 51.4 in February’s flash estimate from 52 in January, showing that the business activity in the US’ private sector continued to expand, albeit at a softer pace than in January.
S&P Global Manufacturing PMI improved to 51.5 from 50.7 in the same period, while S&P Global Services PMI edged lower to 51.3 from 52.5.
The survey pointed out that cost pressures eased for manufacturers and service providers again in February, with input prices rising at the weakest pace since October 2020.
Commenting on the survey’s findings, “the early PMI data for February indicate that the US economy continued to expand midway through the first quarter, pointing to annualized GDP growth in the region of 2%,” said Chris Williamson, Chief Business Economist at S&P Global Market Intelligence.
“Although service sector growth cooled slightly, manufacturing staged a welcome return to growth, with factory output growing at the fastest rate for ten months,” Williamson added.
Market reaction to US S&P Global PMI data
The US Dollar (USD) stays resilient against its rivals following the PMI data. At the time of press, the USD Index (DXY) was virtually unchanged on the day at 104.02.
US Dollar price today
The table below shows the percentage change of US Dollar (USD) against listed major currencies today. US Dollar was the strongest against the Swiss Franc.
| USD | EUR | GBP | CAD | AUD | JPY | NZD | CHF | |
| USD | 0.02% | 0.08% | -0.09% | -0.08% | 0.06% | -0.18% | 0.18% | |
| EUR | -0.01% | 0.06% | -0.13% | -0.12% | 0.04% | -0.19% | 0.14% | |
| GBP | -0.07% | -0.06% | -0.18% | -0.15% | -0.01% | -0.24% | 0.11% | |
| CAD | 0.08% | 0.13% | 0.18% | 0.03% | 0.18% | -0.06% | 0.29% | |
| AUD | 0.06% | 0.12% | 0.14% | -0.02% | 0.14% | -0.07% | 0.23% | |
| JPY | -0.07% | -0.02% | -0.02% | -0.14% | -0.19% | -0.23% | 0.14% | |
| NZD | 0.18% | 0.19% | 0.24% | 0.06% | 0.09% | 0.25% | 0.35% | |
| CHF | -0.15% | -0.16% | -0.10% | -0.26% | -0.23% | -0.10% | -0.35% |
The heat map shows percentage changes of major currencies against each other. The base currency is picked from the left column, while the quote currency is picked from the top row. For example, if you pick the Euro from the left column and move along the horizontal line to the Japanese Yen, the percentage change displayed in the box will represent EUR (base)/JPY (quote).
This section below was published as a preview of the US S&P Global PMI surveys at 09:00 GMT.
- S&P Global PMIs are expected to indicate business activity in the US continued to expand in February.
- Manufacturing and Services output seen advancing at a moderate pace.
- EUR/USD stuck around 1.0800, signs of buyers losing interest.
S&P Global will release the flash estimates of the United States (US) Purchasing Managers Indexes (PMIs) on Thursday, a survey that measures business activity throughout the month. The report is divided into services and manufacturing output and compiled in a final figure, the Composite PMI.
The economic activity in the US private sector expanded at a modest pace in January, with the S&P Global Composite PMI reaching 52.0, following a bounce in manufacturing output to 50.7. At the same time, the services index reached 52.5.
Manufacturing has been lagging behind, although the latest reading has been quite encouraging, as it showed improvement in the sector’s health for the first time since April 2023. The official report notes: “Overall growth was supported by a return to expansion in new orders and a slower contraction in output. Production was reportedly hampered, however, by a renewed decline in supplier performance and longer input deliveries. Greater transportation costs pushed input prices higher on the month, with cost inflation hitting a nine-month high. In response, firms hiked their selling prices at the fastest rate since April 2023.”
The US economy is in expansion mode, which means the country will likely dodge a recession and even a soft landing. But this could come at the cost of higher inflation, which may prompt the Federal Reserve (Fed) into additional tightening. In such a case, higher rates will increase the risk of an economic setback.
The US Fed paused monetary tightening in the last quarter of 2023, and market participants rushed to price in upcoming rate cuts. The odds centered in March as policymakers continued to deliver the “higher-for-longer” message. However, the late January Fed monetary policy meeting and hotter-than-anticipated inflation in January convinced investors that policymakers won’t rush into loosening the monetary policy. At the time being, the first rate cut is more likely to take place in June.
What to expect from the next S&P Global PMI report?
The February S&P Global Manufacturing PMI is foreseen at 50.5, ticking modestly lower from the previous 50.7, although holding within expansionary levels. The same situation is expected around services output, as the index is expected at 52.0, easing from 52.5 in January.
As long as the readings remain above 50.0, the impact of a decline should be limited. However, a slump below the line that separates expansion and contraction could revive speculation of a Fed rate cut amid renewed recession-related concerns. That could spur optimism for risk assets and weigh on the US Dollar.
On the contrary, stronger-than-anticipated figures will give the Fed more time to hold rates unchanged and assess more data before deciding on a monetary policy change.
When will February flash US S&P Global PMIs be released and how could they affect EUR/USD?
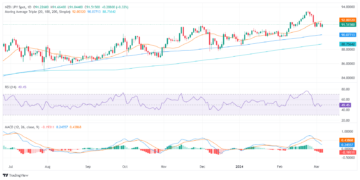
The S&P Global PMI report will be released this Thursday at 14:45 GMT. Ahead of the event, the US Dollar has been trimming panic-related gains, with EUR/USD currently trading at around 1.0800. The pair collapsed to 1.0694 in mid-February following the release of the January US Consumer Price Index (CPI), which surpassed market expectations, but as market players assumed that a Fed’s rate cut would be more likely for June, the sentiment began improving.
Tepid European data, however, has limited the bullish potential of the Euro, which anyway advanced against its American rival.
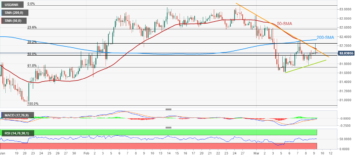
Valeria Bednarik, Chief Analyst at FXStreet, said: “The EUR/USD pair has reached a three-week peak at 1.0839, but it is clear that selling around the 1.0800 level is strong, as gains beyond it have been quickly reverted in the last two weeks. Market players are waiting for a solid catalyst that the market is failing to provide.” Furthermore, she adds: “The ongoing recovery seems corrective. EUR/USD hovers around the 23.6% Fibonacci retracement of the 1.1139-1.0694 decline at 1.0799. The next Fibonacci resistance level falls at 1.0864, a level the pair needs to reconquer to encourage buyers.”
Bednarik also notes: “Technical readings in the daily chart support the corrective case, and even suggest the pair may resume its slide in the near term. Technical indicators are retreating after failing to overcome their midlines, heading south with uneven strength. Also, the pair is battling around the converging 20 and 100 Simple Moving Averages (SMAs), which stand alongside the aforementioned Fibonacci level. Support comes at 1.0770 and 1.0720, with a break below the latter opening the door for a fresh 2024 low.”
US Dollar FAQs
The US Dollar (USD) is the official currency of the United States of America, and the ‘de facto’ currency of a significant number of other countries where it is found in circulation alongside local notes. It is the most heavily traded currency in the world, accounting for over 88% of all global foreign exchange turnover, or an average of $6.6 trillion in transactions per day, according to data from 2022.
Following the second world war, the USD took over from the British Pound as the world’s reserve currency. For most of its history, the US Dollar was backed by Gold, until the Bretton Woods Agreement in 1971 when the Gold Standard went away.
The most important single factor impacting on the value of the US Dollar is monetary policy, which is shaped by the Federal Reserve (Fed). The Fed has two mandates: to achieve price stability (control inflation) and foster full employment. Its primary tool to achieve these two goals is by adjusting interest rates.
When prices are rising too quickly and inflation is above the Fed’s 2% target, the Fed will raise rates, which helps the USD value. When inflation falls below 2% or the Unemployment Rate is too high, the Fed may lower interest rates, which weighs on the Greenback.
In extreme situations, the Federal Reserve can also print more Dollars and enact quantitative easing (QE). QE is the process by which the Fed substantially increases the flow of credit in a stuck financial system.
It is a non-standard policy measure used when credit has dried up because banks will not lend to each other (out of the fear of counterparty default). It is a last resort when simply lowering interest rates is unlikely to achieve the necessary result. It was the Fed’s weapon of choice to combat the credit crunch that occurred during the Great Financial Crisis in 2008. It involves the Fed printing more Dollars and using them to buy US government bonds predominantly from financial institutions. QE usually leads to a weaker US Dollar.
Quantitative tightening (QT) is the reverse process whereby the Federal Reserve stops buying bonds from financial institutions and does not reinvest the principal from the bonds it holds maturing in new purchases. It is usually positive for the US Dollar.
- SEO Powered Content & PR Distribution. Get Amplified Today.
- PlatoData.Network Vertical Generative Ai. Empower Yourself. Access Here.
- PlatoAiStream. Web3 Intelligence. Knowledge Amplified. Access Here.
- PlatoESG. Carbon, CleanTech, Energy, Environment, Solar, Waste Management. Access Here.
- PlatoHealth. Biotech and Clinical Trials Intelligence. Access Here.
- Source: https://www.fxstreet.com/news/us-sp-global-pmis-preview-economic-expansion-set-to-moderate-in-february-202402220900
- :has
- :is
- :not
- :where
- ][p
- $UP
- 00
- 02
- 09
- 1
- 100
- 14
- 2%
- 20
- 2008
- 2020
- 2022
- 2023
- 2024
- 23
- 29
- 31
- 35%
- 36
- 4
- 40
- 41
- 45
- 5
- 50
- 51
- 52
- 6
- 7
- a
- above
- According
- Accounting
- Achieve
- activity
- added
- Additional
- Adds
- adjusting
- advanced
- advancing
- affect
- After
- again
- against
- Agreement
- ahead
- albeit
- All
- along
- alongside
- also
- Although
- america
- American
- Amid
- an
- analyst
- and
- Animate
- annualized
- anyway
- April
- ARE
- around
- AS
- assess
- Assets
- assumed
- At
- average
- away
- backed
- Banks
- base
- battling
- BE
- because
- been
- before
- began
- behind
- being
- below
- Beyond
- bis
- Bonds
- Bounce
- Box
- Break
- Bretton
- Bretton Woods
- British
- British Pound
- Bullish
- business
- but
- buy
- buyers
- Buying
- by
- CAN
- case
- Catalyst
- centered
- change
- Changes
- Chart
- chief
- choice
- Chris
- Circulation
- clear
- collapsed
- Column
- combat
- come
- comes
- compiled
- Concerns
- consumer
- consumer price index
- content
- continued
- contraction
- contrary
- control
- control inflation
- converging
- convinced
- Cost
- Costs
- could
- Counterparty
- countries
- country
- CPI
- credit
- crisis
- crunch
- currencies
- Currency
- Currently
- Cut
- cuts
- daily
- data
- day
- Deciding
- Decline
- Default
- deliver
- Deliveries
- displayed
- divided
- Dodge
- does
- Dollar
- dollars
- Door
- during
- Dxy
- each
- Early
- easing
- Economic
- Economist
- economy
- edges
- employment
- encourage
- encouraging
- ends
- estimate
- estimates
- Ether (ETH)
- EUR
- EUR/USD
- Euro
- European
- European Data
- Even
- Event
- example
- exchange
- Expand
- expanded
- expansion
- expect
- expectations
- expected
- extreme
- factor
- factory
- failing
- Falls
- FAQ
- fastest
- fear
- February
- Fed
- Federal
- federal reserve
- Fibonacci
- Figure
- Figures
- final
- financial
- financial crisis
- Financial institutions
- financial system
- findings
- firms
- First
- first time
- Flash
- flow
- following
- For
- foreign
- foreign exchange
- Foster
- found
- Franc
- fresh
- from
- full
- Furthermore
- Gains
- GDP
- gdp growth
- Give
- Global
- global market
- GMT
- Goals
- Gold
- Gold Standard
- Government
- government bonds
- great
- greater
- Greenback
- Growing
- Growth
- Have
- Heading
- Health
- heavily
- helps
- High
- higher
- history
- hitting
- hold
- holding
- holds
- Horizontal
- How
- However
- HTTPS
- if
- Impact
- impacting
- important
- improved
- improvement
- improves
- improving
- in
- Increase
- Increases
- index
- indexes
- indicate
- Indicators
- inflation
- input
- institutions
- Intelligence
- interest
- Interest Rates
- into
- Investors
- involves
- IT
- ITS
- January
- Japanese
- Japanese Yen
- jpg
- june
- lagging
- landing
- Last
- Late
- latest
- latter
- Leads
- left
- LEND
- Level
- levels
- likely
- Limited
- Line
- Listed
- local
- Long
- longer
- losing
- Low
- lower
- lowering
- major
- Managers
- mandates
- Manufacturers
- manufacturing
- map
- March
- Market
- May..
- means
- measure
- measures
- meeting
- message
- MidWay
- Mode
- moderate
- modest
- module
- Monetary
- Monetary Policy
- monetary tightening
- Month
- months
- more
- most
- move
- moving
- moving averages
- Near
- necessary
- needs
- New
- next
- Notes
- number
- occurred
- october
- Odds
- of
- official
- on
- ongoing
- opening
- Optimism
- or
- orders
- Other
- out
- output
- over
- Overcome
- Pace
- pair
- participants
- paused
- Peak
- per
- percentage
- performance
- period
- pick
- picked
- Place
- plato
- Plato Data Intelligence
- PlatoData
- players
- pmi
- policy
- policymakers
- positive
- potential
- pound
- predominantly
- press
- pressures
- Preview
- previous
- price
- Prices
- primary
- Principal
- printing
- private
- private sector
- process
- Production
- provide
- providers
- published
- purchases
- purchasing
- pushed
- QE
- QT
- quantitative
- Quantitative Easing
- Quarter
- quickly
- quite
- quote
- raise
- Rate
- Rates
- reached
- reaching
- reaction
- Reading
- recession
- recovery
- region
- reinvest
- release
- released
- remain
- renewed
- report
- reportedly
- represent
- Reserve
- Reserve Currency
- resilient
- Resistance
- Resort
- response
- result
- resume
- retracement
- return
- reverse
- reverted
- Revive
- rising
- Risk
- risk assets
- Rival
- rivals
- ROW
- rush
- rushed
- s
- S&P
- S&P Global
- Said
- same
- Second
- Second world war
- Section
- sector
- seems
- seen
- Selling
- sentiment
- service
- service providers
- Services
- shaped
- she
- should
- showed
- showing
- Shows
- significant
- Signs
- Simple
- simply
- since
- single
- situation
- situations
- Slide
- slightly
- slower
- Slump
- SMAs
- Soft
- solid
- South
- speculation
- Stability
- stand
- standard
- starts
- States
- stays
- Stops
- strength
- strong
- strongest
- stuck
- substantially
- such
- suggest
- supplier
- support
- Supported
- surpassed
- Survey
- Swiss
- system
- table
- Take
- Target
- Technical
- ten
- term
- than
- that
- The
- the Fed
- The United States of America
- the world
- their
- Them
- These
- they
- this
- Through
- throughout
- thursday
- ticking
- tightening
- time
- to
- today
- too
- took
- tool
- top
- traded
- Trading
- Transactions
- transportation
- Trillion
- turnover
- two
- unemployment
- unemployment rate
- United
- United States
- UNITED STATES OF AMERICA
- unlikely
- until
- upcoming
- us
- US Dollar
- US economy
- us fed
- us government
- US PMIs
- USD
- USD value
- used
- using
- usually
- value
- virtually
- Waiting
- war
- was
- weaker
- Weeks
- weigh
- weighs
- welcome
- went
- What
- when
- which
- while
- will
- with
- within
- Woods
- world
- world’s
- would
- Yen
- you
- zephyrnet


![Daily Stock Report: Elliott Wave technical analysis [Video]](https://platoaistream.net/wp-content/uploads/2023/07/daily-stock-report-elliott-wave-technical-analysis-video-360x270.jpg)