- USD/CAD clings to gains above 1.3500 as Fed rate cut hopes for June wane.
- Investors shift focus to the Fed’s interest rate decision in which the central bank is expected to maintain a status quo.
- The IEA raises Oil demand forecasts by 110K bpd for 2024.
The USD/CAD pair holds strength above the psychological support of 1.3500 in Friday’s European session. The Loonie asset turns sideways after a sharp recovery, prompted by diminished market expectations for the Federal Reserve (Fed) reducing interest rates in the June policy meeting.
Fed policymakers want to see price pressures declining for months to gain confidence that inflation will return sustainably to the desired rate of 2%. However, the United States Producer Price Index (PPI) data for February, released on Thursday, remained stubborn than expected due to rising gasoline and food prices. Tuesday’s consumer price inflation data for February was also sticky from expectations.
The US Dollar Index (DXY) trades sideways after a sharp recovery to 103.50 as investors shift focus to the Fed’s policy decision, which will be announced on Wednesday. The Fed is widely anticipated to keep interest rates unchanged in the range of 5.25%-5.50% but the release of the dot plot and economic projections will be keenly watched.
Meanwhile, the Oil price turns sluggish after a two-day rally. The broader strength in the Oil price remains intact as the International Energy Agency (IEA) has raised its 2024 oil demand forecasts by 110K bpd (barrels per day). It is worth noting that Canada is the leading exporter of Oil to the US and higher oil prices support the Canadian Dollar.
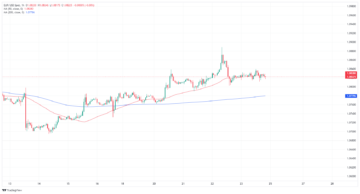
USD/CAD rebounds from the upward-sloping border of the Ascending Triangle pattern, placed from the December 27 low at 1.3177. The horizontal resistance of the aforementioned pattern, formed on a daily timeframe, is plotted from the December 7 high at 1.3620. The near-term trend is bullish as the pair is trading above the 50-day Exponential Moving Average (EMA), which trades around 1.3500. However, investors would gain more conviction after a triangle breakout.
The triangle could break out in either direction. However, the odds marginally favor a move in the direction of the trend before forming the triangle – in this case, up. A decisive break above or below the triangle boundary lines would indicate a breakout is underway.
The 14-period Relative Strength Index (RSI) falls back into the 40.00-60.00 region, which indicates persistent indecisiveness among investors.
Fresh upside would appear if the asset breaks above December 7 high at 1.3620, which will drive the asset towards May 26 high at 1.3655, followed by the round-level resistance of 1.3700.
On the flip side, a downside move below February 22 low at 1.3441 would expose the asset to February 9 low at 1.3413. A breakdown below the latter would extend the downside towards January 15 low at 1.3382.
USD/CAD daily chart

- SEO Powered Content & PR Distribution. Get Amplified Today.
- PlatoData.Network Vertical Generative Ai. Empower Yourself. Access Here.
- PlatoAiStream. Web3 Intelligence. Knowledge Amplified. Access Here.
- PlatoESG. Carbon, CleanTech, Energy, Environment, Solar, Waste Management. Access Here.
- PlatoHealth. Biotech and Clinical Trials Intelligence. Access Here.
- Source: https://www.fxstreet.com/news/usd-cad-price-analysis-exhibits-strength-above-13500-as-focus-shifts-to-fed-policy-202403151121
- :has
- :is
- $UP
- 00
- 1
- 15%
- 2%
- 2024
- 22
- 26
- 27
- 40
- 5
- 50
- 7
- 9
- a
- above
- After
- agency
- among
- analysis
- and
- announced
- Anticipated
- appear
- around
- AS
- ascending
- asset
- At
- average
- back
- Bank
- barrels
- BE
- before
- below
- border
- Break
- break out
- Breakdown
- breakout
- breaks
- broader
- Bullish
- but
- by
- Canada
- Canadian
- Canadian Dollar
- case
- central
- Central Bank
- confidence
- consumer
- conviction
- could
- Cut
- daily
- data
- day
- December
- decision
- decisive
- Declining
- Demand
- desired
- direction
- Dollar
- DOT
- downside
- drive
- due
- Dxy
- Economic
- either
- EMA
- energy
- European
- exhibits
- expectations
- expected
- exponential
- exponential moving average
- extend
- Falls
- favor
- February
- Fed
- Federal
- federal reserve
- Flip
- Focus
- followed
- food
- For
- forecasts
- formed
- forming
- from
- Gain
- Gains
- gasoline
- High
- higher
- holds
- hopes
- Horizontal
- However
- HTTPS
- IEA
- if
- in
- index
- indicate
- indicates
- inflation
- interest
- INTEREST RATE
- Interest Rates
- International
- into
- Investors
- IT
- ITS
- January
- june
- Keep
- latter
- leading
- lines
- Low
- maintain
- marginally
- Market
- May..
- meeting
- months
- more
- move
- moving
- moving average
- noting
- Odds
- of
- Oil
- oil price
- on
- or
- out
- pair
- Pattern
- per
- placed
- plato
- Plato Data Intelligence
- PlatoData
- plot
- policy
- policymakers
- ppi
- pressures
- price
- Price Analysis
- Prices
- projections
- psychological
- raised
- raises
- rally
- range
- Rate
- Rates
- recovery
- reducing
- region
- relative
- relative strength index
- Relative Strength Index (RSI)
- release
- released
- remained
- remains
- Reserve
- Resistance
- return
- rising
- rsi
- see
- session
- sharp
- shift
- Shifts
- side
- sideways
- sluggish
- States
- Status
- strength
- support
- sustainably
- than
- that
- The
- this
- thursday
- timeframe
- to
- towards
- trades
- Trading
- Trend
- turns
- unchanged
- Underway
- United
- United States
- Upside
- us
- US Dollar
- USD/CAD
- want
- was
- Wednesday
- which
- widely
- will
- worth
- would
- zephyrnet