- A firmer March’s US CPI has altered the relative fundamentals narrative between the US & Japan.
- Reduces the risk of FX intervention from Japanese authorities to prop up a weaker JPY due to the lack of supporting fundamentals.
- The bullish reversal seen in the 10-year yield spread of the US Treasury over JGB may act as an impetus to support further US dollar strength.
- Watch the next intermediate resistances of 153.50 & 154.25 on the USD/JPY.
This is a follow-up analysis of our prior report, “USD/JPY: JPY continued to sell off after BoJ put an historic end to its negative rate regime” published on 19 March 2024. Click here for a recap.
The USD/JPY has managed to decisively punch above its 151.95 major resistance yesterday, 10 April ex-post US CPI data release to print a daily close of 153.15, its highest level since June 1990.
The US inflation data release has come in firmer than expected, the core CPI rate (excluding food & energy) rose to 3.8% y/y in March, above the consensus of 3.7% y/y. In addition, the subcomponent services inflation accelerated to 5.3% y/y in March from 4.9% y/y in February, making it the highest rate of increase since August 2023.
In the past six months, the 151.95 level on the USD/JPY is considered pivotal as it managed to create a “floor” to prevent the JPY from seeing further weakness against the US dollar due to a slew of constant verbal interventions from Japan’s Ministry of Finance (MoF) officials when it traded close to the 151.95 level.
Also, the most recent actual intervention in the foreign exchange market by Japanese authorities took place previously on 21 October 2022 when the USD/JPY hit an intraday high of 151.95 before the Bank of Japan (BoJ) under the instructions of the MoF sold US dollars against JPY that led to a significant decline of -16% in the next four months on the USD/JPY, and it tumbled to a low of 127.22 on 16 January 2023.
FX intervention operations may be futile now due to a change in fundamentals

Fig 1: Probability of Fed funds rate outcome as of 11 Apr 2024 (Source: CME FedWatch Tool, click to enlarge chart)
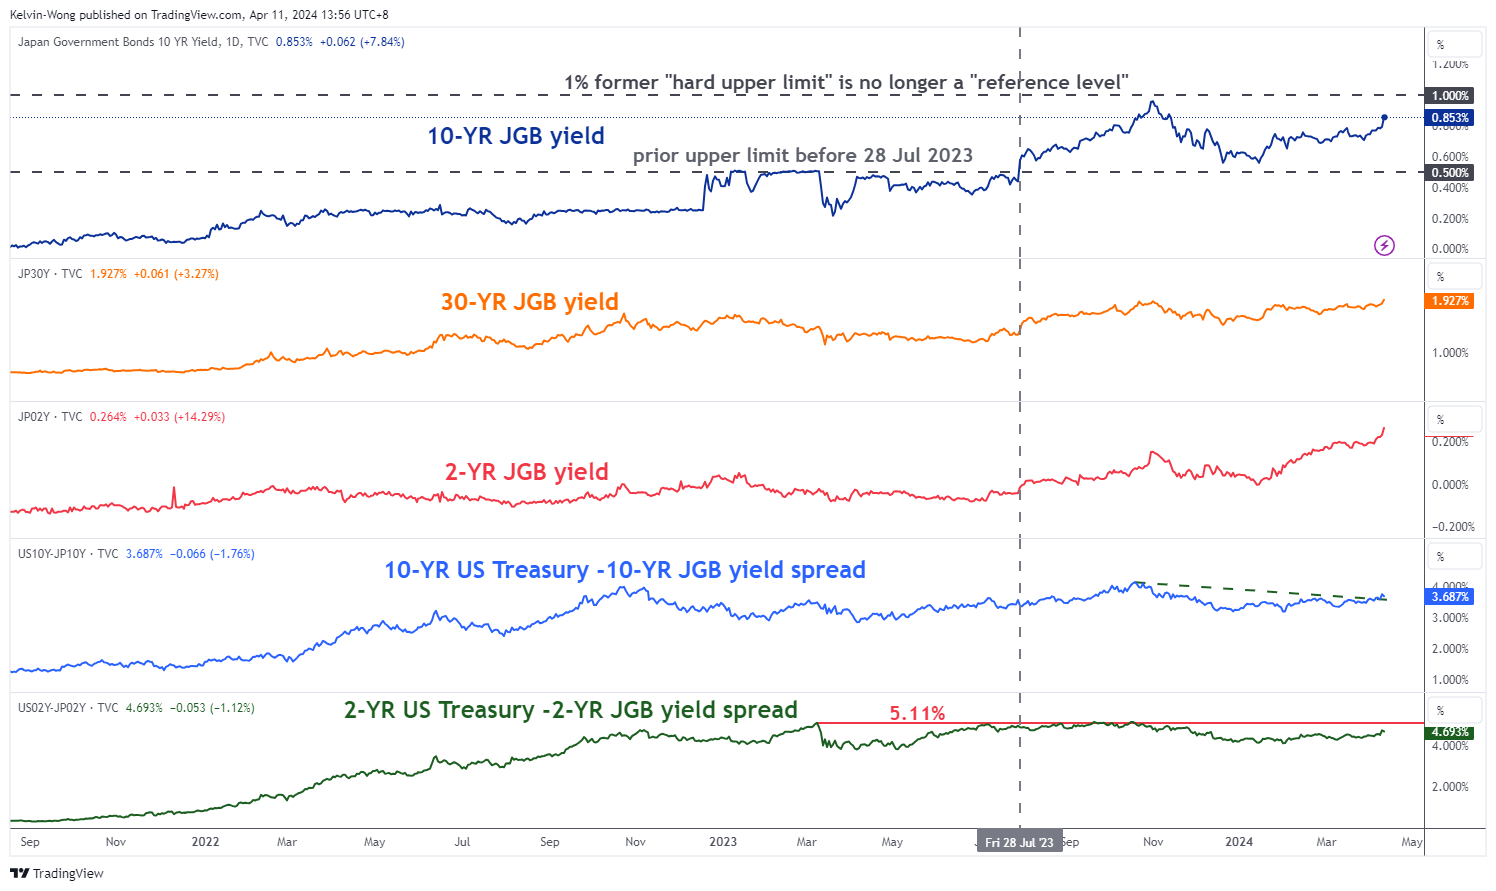
Fig 2: US Treasuries/JGB yield spreads medium-term trends as of 11 Apr 2024 (Source: TradingView, click to enlarge chart)
The impact of the ‘Fed dovish pivot” narrative has been greatly diminished at this juncture where the highly anticipated six Fed funds rate cuts expected at the start of the year has been watered down to only two cuts before 2024 ends as priced by current Fed funds rate futures market according to the CME FedWatch tool.
Also, the first Fed funds rate cut is being pushed further down the calendar to September’s FOMC meeting (69% chance) now from July’s FOMC meeting (reduced to 45% chance now from 68% at the start of this week) (see Fig 1).
Yesterday’s uptick in March’s US CPI has led to rallies in both US Treasury and Japanese Government bond (JGB) yields. However, the pace of increase is more pronounced in the US Treasury yields both in the short and long ends over JGB yields.
The yield spread of the 10-year US Treasury over 10-year JGB has risen by 22 basis points from last Thursday, 4 April to print a closing level of 3.75% yesterday which in turn broke above a major resistance at 3.60%.
Secondly, the shorter-term yield spread of the 2-year US Treasury over the 2-year JGB has jumped up by a slightly higher magnitude of 30 bps to hit a closing level of 4.75% yesterday, just a whisker away from its major resistance level of 5.11% (see Fig 2).
In a nutshell, relative movement in sovereign bond yields is one of the key factors that drives the directional basis in FX pairs, and coupled with the current dynamics of inflationary trends in the US that tend to support a stronger US dollar, any intervention attempts by Japanese authorities to significantly reverse the current state of JPY’s weakness at this juncture may be unsuccessful because relative fundaments (yield spread between US Treasuries & JGBs) are not supporting a stronger JPY.
153.50 & 154.25 are the next short-term resistances to watch on USD/JPY
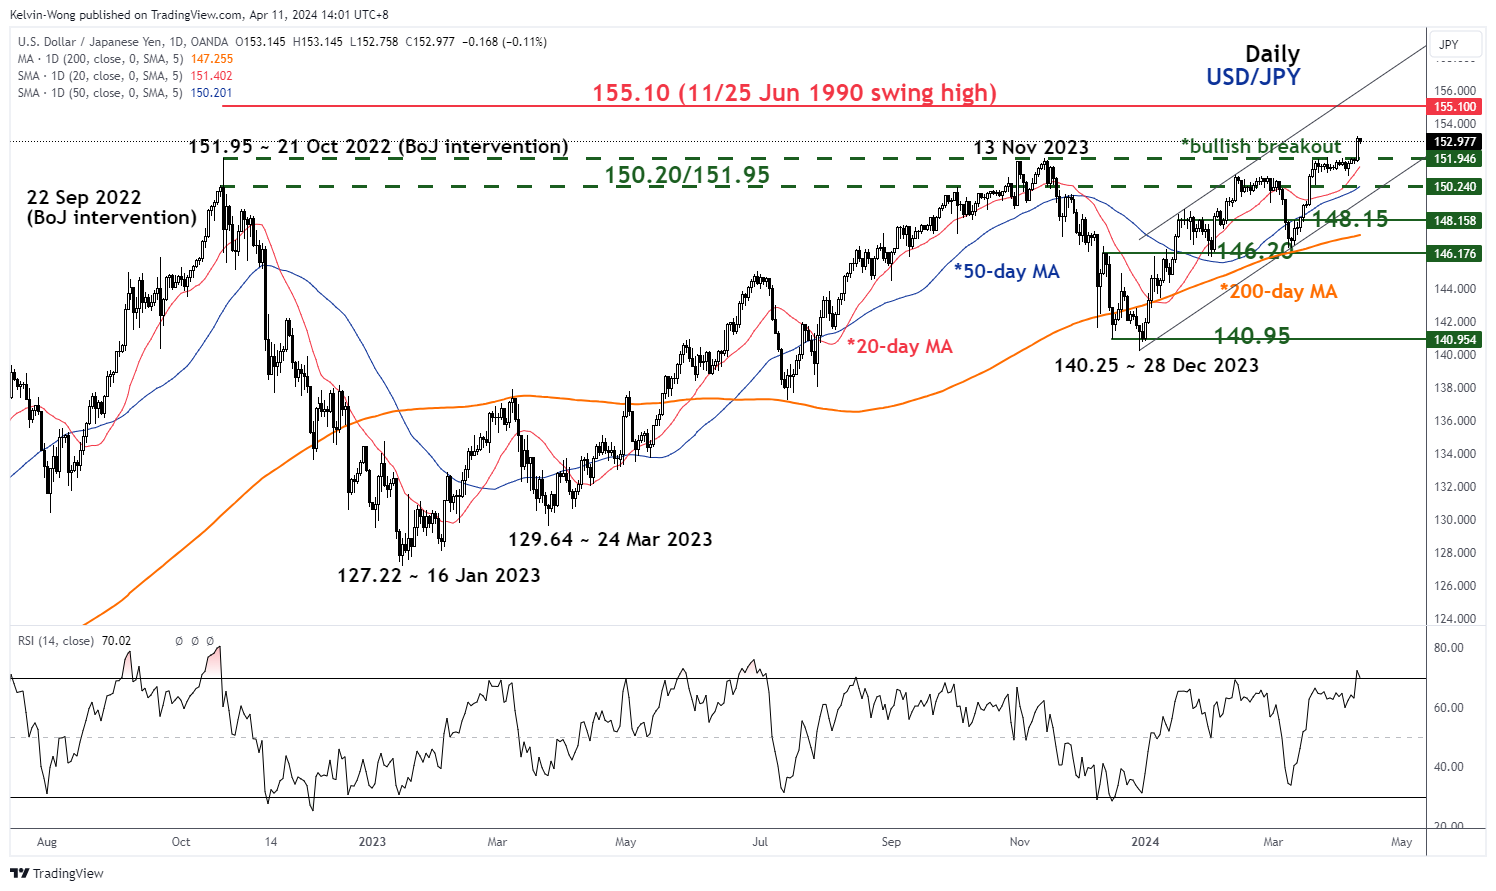
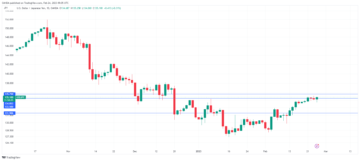
Fig 3: USD/JPY major & medium-term trends as of 11 Apr 2024 (Source: TradingView, click to enlarge chart)
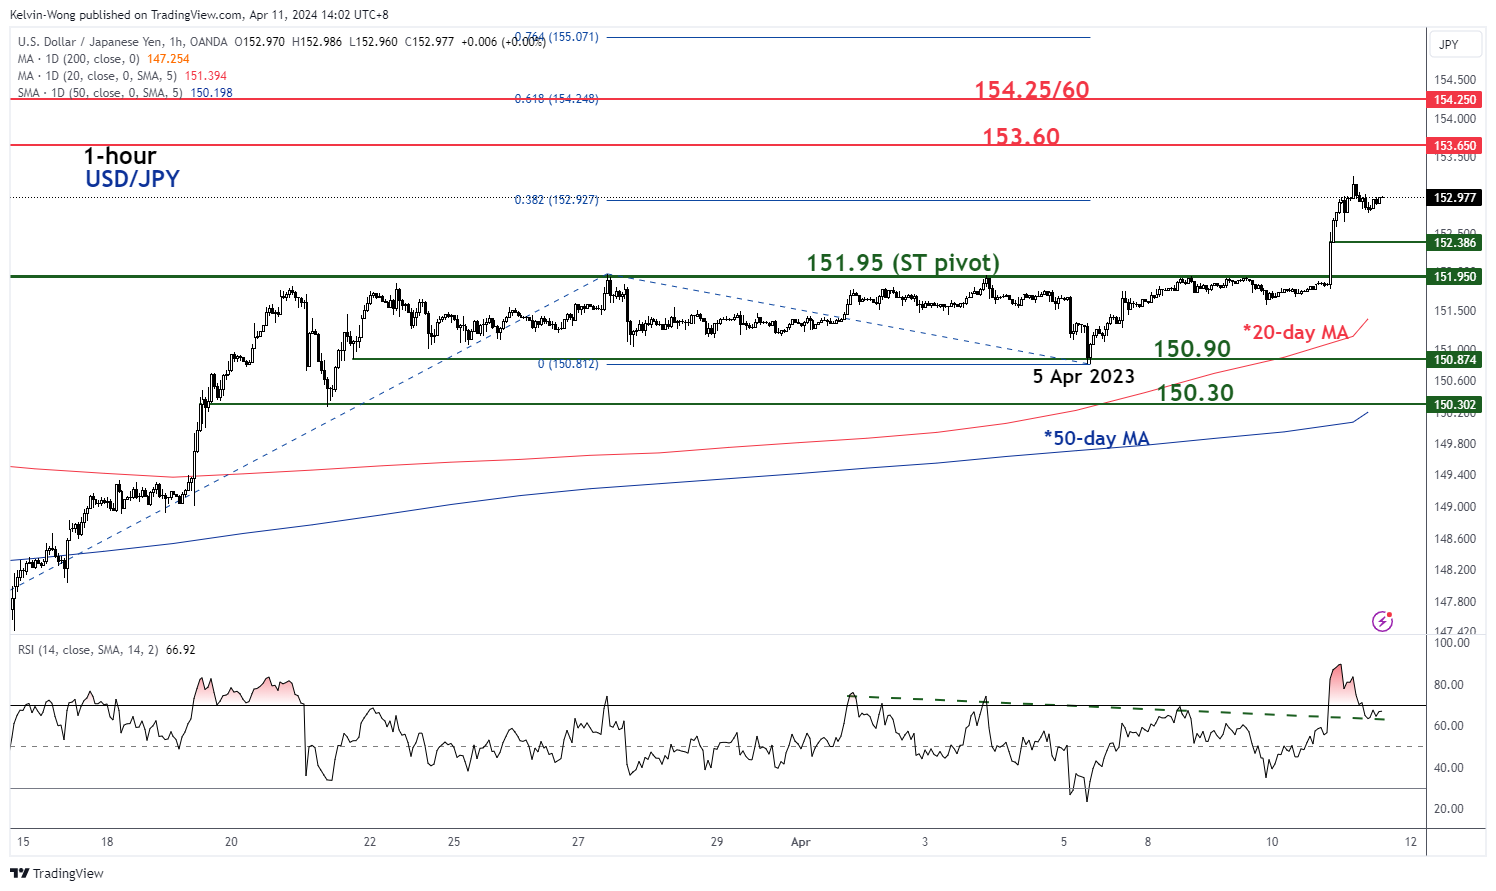
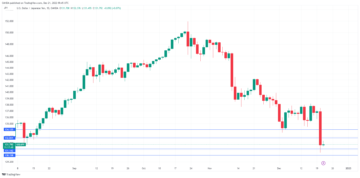
Fig 4: USD/JPY short-term trends as of 11 Apr 2024 (Source: TradingView, click to enlarge chart)
Yesterday’s bullish breakout from its three-week sideways range configuration in place since 20 March 2024 has led the USD/JPY to transform at least into a short-term uptrend phase structure.
The current minor impulsive upmove sequence remains intact as long as the 151.85 short-term pivotal support holds. The next intermediate resistances to watch will be at 153.60 and 154.25/60 (see Fig 4).
However, a reintegration back below 151.95 is considered a bull trap or failure bullish breakout for a potential slide to expose the next intermediate supports at 150.90 and 150.30 (also the upward-slopping 50-day moving average) in the first step.
Content is for general information purposes only. It is not investment advice or a solution to buy or sell securities. Opinions are the authors; not necessarily that of OANDA Business Information & Services, Inc. or any of its affiliates, subsidiaries, officers or directors. If you would like to reproduce or redistribute any of the content found on MarketPulse, an award winning forex, commodities and global indices analysis and news site service produced by OANDA Business Information & Services, Inc., please access the RSS feed or contact us at info@marketpulse.com. Visit https://www.marketpulse.com/ to find out more about the beat of the global markets. © 2023 OANDA Business Information & Services Inc.
Passionate about connecting the dots in the financial markets and sharing perspectives around trading and investment, Kelvin Wong is an expert in using a unique combination of fundamental and technical analyses, specializing in Elliott Wave and fund flow positioning, to pinpoint key reversal levels in the financial markets.
In addition, over the last ten years, Kelvin has conducted numerous market outlook and trading-related seminars, as well as technical analysis training courses, for thousands of retail traders.
Latest posts by Kelvin Wong (see all)
- SEO Powered Content & PR Distribution. Get Amplified Today.
- PlatoData.Network Vertical Generative Ai. Empower Yourself. Access Here.
- PlatoAiStream. Web3 Intelligence. Knowledge Amplified. Access Here.
- PlatoESG. Carbon, CleanTech, Energy, Environment, Solar, Waste Management. Access Here.
- PlatoHealth. Biotech and Clinical Trials Intelligence. Access Here.
- Source: https://www.marketpulse.com/forex/usd-jpy-technical-rising-us-treasury-jgb-yield-spreads-outweigh-bojs-intervention-risk/kwong
- :has
- :is
- :not
- :where
- $UP
- 1
- 10
- 11
- 127
- 15 years
- 15%
- 150
- 16
- 19
- 2%
- 20
- 2022
- 2023
- 2024
- 21
- 22
- 25
- 30
- 4
- 5
- 50
- 60
- 700
- 90
- a
- About
- above
- accelerated
- access
- According
- Act
- actual
- addition
- advice
- affiliates
- After
- against
- also
- altered
- an
- analyses
- analysis
- and
- Anticipated
- any
- apr
- April
- ARE
- around
- AS
- At
- Attempts
- AUGUST
- author
- Authorities
- authors
- avatar
- average
- award
- away
- back
- Bank
- bank of japan
- Bank of Japan (BoJ)
- basis
- BE
- beat
- because
- been
- before
- being
- below
- between
- boj
- bond
- Bond yields
- both
- Box
- breakout
- Broke
- bull
- bull trap
- Bullish
- business
- buy
- by
- Calendar
- Chance
- change
- Chart
- click
- Close
- closing
- CME
- COM
- combination
- come
- Commodities
- conducted
- Configuration
- Connecting
- Consensus
- considered
- constant
- contact
- content
- continued
- Core
- coupled
- courses
- CPI
- CPI data
- create
- Current
- Current state
- Cut
- cuts
- daily
- data
- Decline
- Directors
- Dollar
- dollars
- Dovish
- down
- drives
- due
- dynamics
- Elliott
- end
- ends
- energy
- enlarge
- Ether (ETH)
- exchange
- excluding
- expected
- experience
- expert
- expose
- factors
- Failure
- February
- Fed
- fed funds rate
- Fig
- finance
- financial
- Find
- First
- flow
- FOMC
- food
- For
- foreign
- foreign exchange
- foreign exchange market
- forex
- found
- four
- from
- fund
- fundamental
- Fundamentals
- funds
- further
- futile
- Futures
- FX
- General
- Global
- global markets
- Government
- greatly
- High
- higher
- highest
- highly
- historic
- Hit
- holds
- However
- HTTPS
- if
- Impact
- impulsive
- in
- Inc.
- Increase
- Indices
- inflation
- Inflationary
- information
- instructions
- Intermediate
- intervention
- interventions
- into
- investment
- IT
- ITS
- January
- Japan
- Japan’s
- Japanese
- JGB
- JPY
- jumped
- june
- just
- Kelvin
- Key
- Lack
- Last
- least
- Led
- Level
- levels
- like
- Long
- Low
- Macro
- magnitude
- major
- Making
- managed
- March
- March 2024
- Market
- market outlook
- market research
- MarketPulse
- Markets
- max-width
- May..
- meeting
- ministry
- minor
- months
- more
- most
- movement
- moving
- moving average
- NARRATIVE
- necessarily
- negative
- news
- next
- now
- numerous
- Nutshell
- october
- of
- off
- officers
- officials
- on
- ONE
- only
- Operations
- Opinions
- or
- our
- out
- Outcome
- Outlook
- outweigh
- over
- Pace
- pairs
- passionate
- past
- perspectives
- phase
- photo
- pivotal
- Place
- plato
- Plato Data Intelligence
- PlatoData
- please
- points
- positioning
- Posts
- potential
- prevent
- previously
- Prior
- probability
- Produced
- pronounced
- providing
- published
- punch
- purposes
- pushed
- put
- rallies
- range
- Rate
- recap
- recent
- Reduced
- relative
- release
- remains
- research
- Resistance
- retail
- Reversal
- reverse
- Risen
- rising
- Risk
- ROSE
- rss
- Securities
- see
- seeing
- seen
- sell
- senior
- Sequence
- service
- Services
- sharing
- Short
- short-term
- sideways
- significant
- significantly
- since
- Singapore
- site
- SIX
- Six months
- Slide
- slightly
- sold
- solution
- Source
- sovereign
- specializing
- spread
- Spreads
- start
- State
- Step
- stock
- Stock markets
- Strategist
- strength
- stronger
- structure
- subsidiaries
- support
- Supporting
- Supports
- Technical
- Technical Analysis
- ten
- tend
- than
- that
- The
- this
- this week
- thousands
- thursday
- to
- took
- tool
- traded
- Traders
- Trading
- TradingView
- Training
- Transform
- Treasuries
- treasury
- Treasury yields
- Trends
- TURN
- two
- under
- unique
- uptrend
- us
- US CPI
- US Dollar
- US Dollars
- us inflation
- us treasuries
- US Treasury
- US treasury yields
- USD/JPY
- using
- v1
- Visit
- Watch
- Wave
- weaker
- weakness
- week
- WELL
- when
- which
- will
- winning
- with
- wong
- would
- year
- years
- yesterday
- Yield
- yields
- you
- zephyrnet