- USD/JPY has shed -5.4% from its 30 June 2023 high of 145.07, on sight to record its worst weekly loss since 7 November 2022.
- Today’s intraday sell-off has managed to hold at the 200-day moving average acting as support at 137.65.
- Short-term momentum has turned positive which increases the odds of a corrective rebound.
This is a follow-up on our prior analysis “USD/JPY Technical: “At risk of a minor bounce before bearish tone resumes” published earlier this week on 11 July 2023. The USD/JPY has tumbled in an almost straight-line fashion on broke below the 138.70 short-term support as highlighted (click here for a recap).
The USD/JPY has torpedoed downwards by -5.40% from its recent high of 145.07 printed on 30 June 2023 to today, 14 July Asian session intraday low of 137.24 at this time of the writing. It has challenged the key 200-day moving average and recorded its worse weekly loss since the week of 7 November 2022.
Talks of an imminent ultra-dovish monetary policy shift from the Bank of Japan (BoJ) in the upcoming monetary policy decision meeting on 28 July have started to make their rounds again.
In today, 13 July Asian session, there are two news flows that advocate a tilt away from negative interest rates in Japan. Firstly, local Japanese media, Yomiuri reported that BoJ is likely to raise its FY 2023 annual inflation forecast to above 2% for its latest quarterly outlook report which is released on the same day as the upcoming 28 July monetary policy decision outcome.
Secondly, former BoJ official, Hideo Hayakawa commented that he is expecting another tweak to the yield curve control programme on 28 July with a more aggressive bias of 50 basis points (bps) widening on the band of around 0% on the 10-year Japanese Government Bonds (JGB) yield to 1% from the current level of 0.5%. Previously, BoJ caught markets by surprise by widening the 10-year JGB yield band by 25 bps on 20 December 2022.
Holding at key 200-day moving average
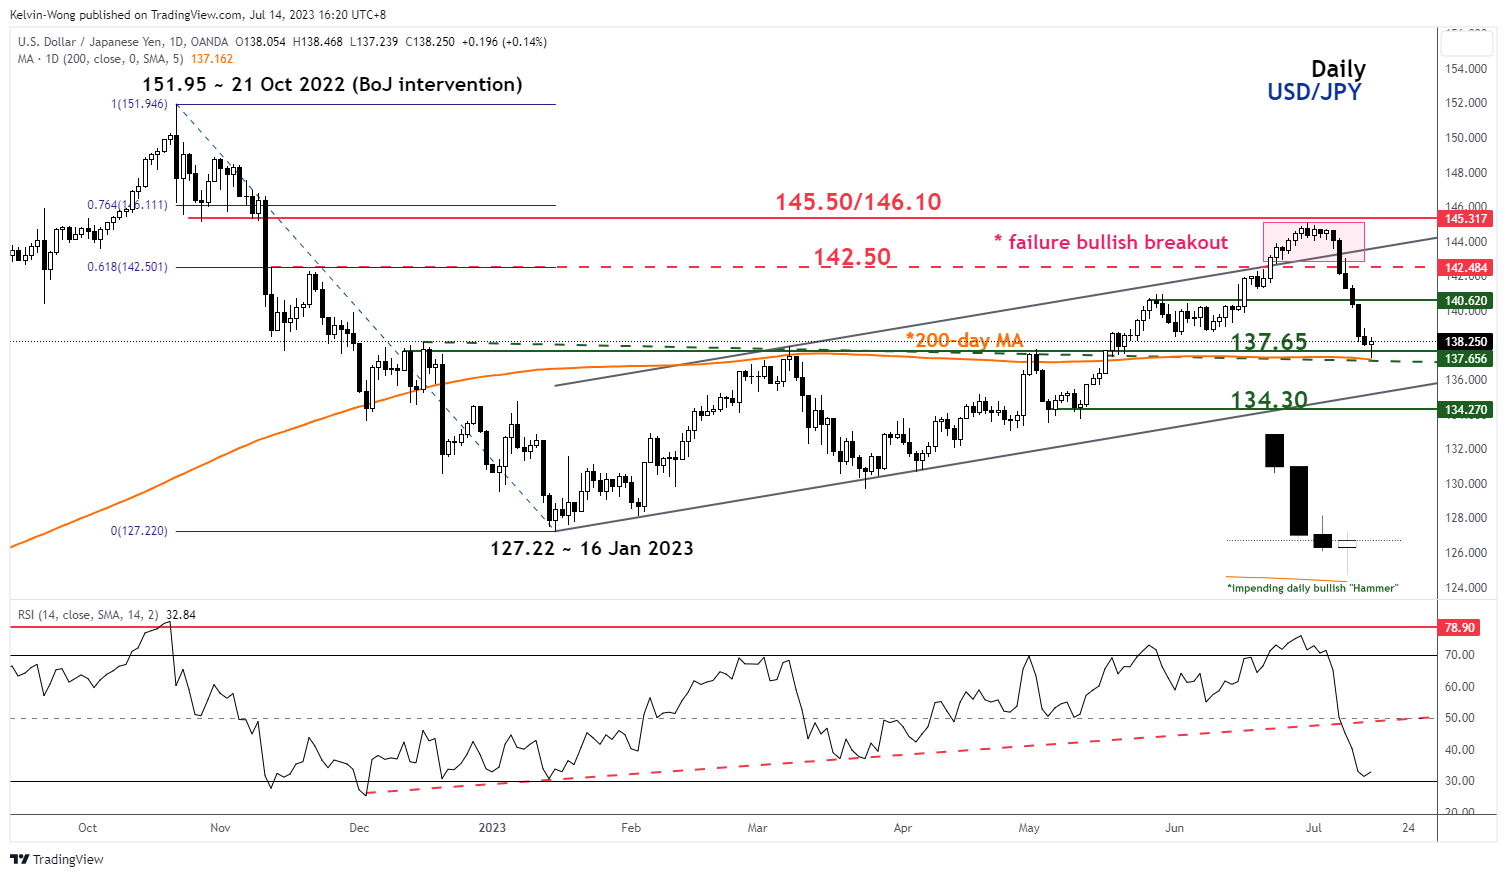
Fig 1: US/JPY medium-term trend as of 14 Jul 2023 (Source: TradingView, click to enlarge chart)
The current decline in place since 30 June 2023 has reached its 200-day moving average which confluences with a graphical support of 137.65 (former swing high areas of 15 December 2022, 8 March 2023, and 2 May 2023).
In addition, today’s price action at this time of the writing has formed an impending bullish daily “Hammer” candlestick pattern which indicates that odds have risen for a potential minor rebound in price actions to retrace the prior five days of steep descent.
Positive short-term momentum has emerged
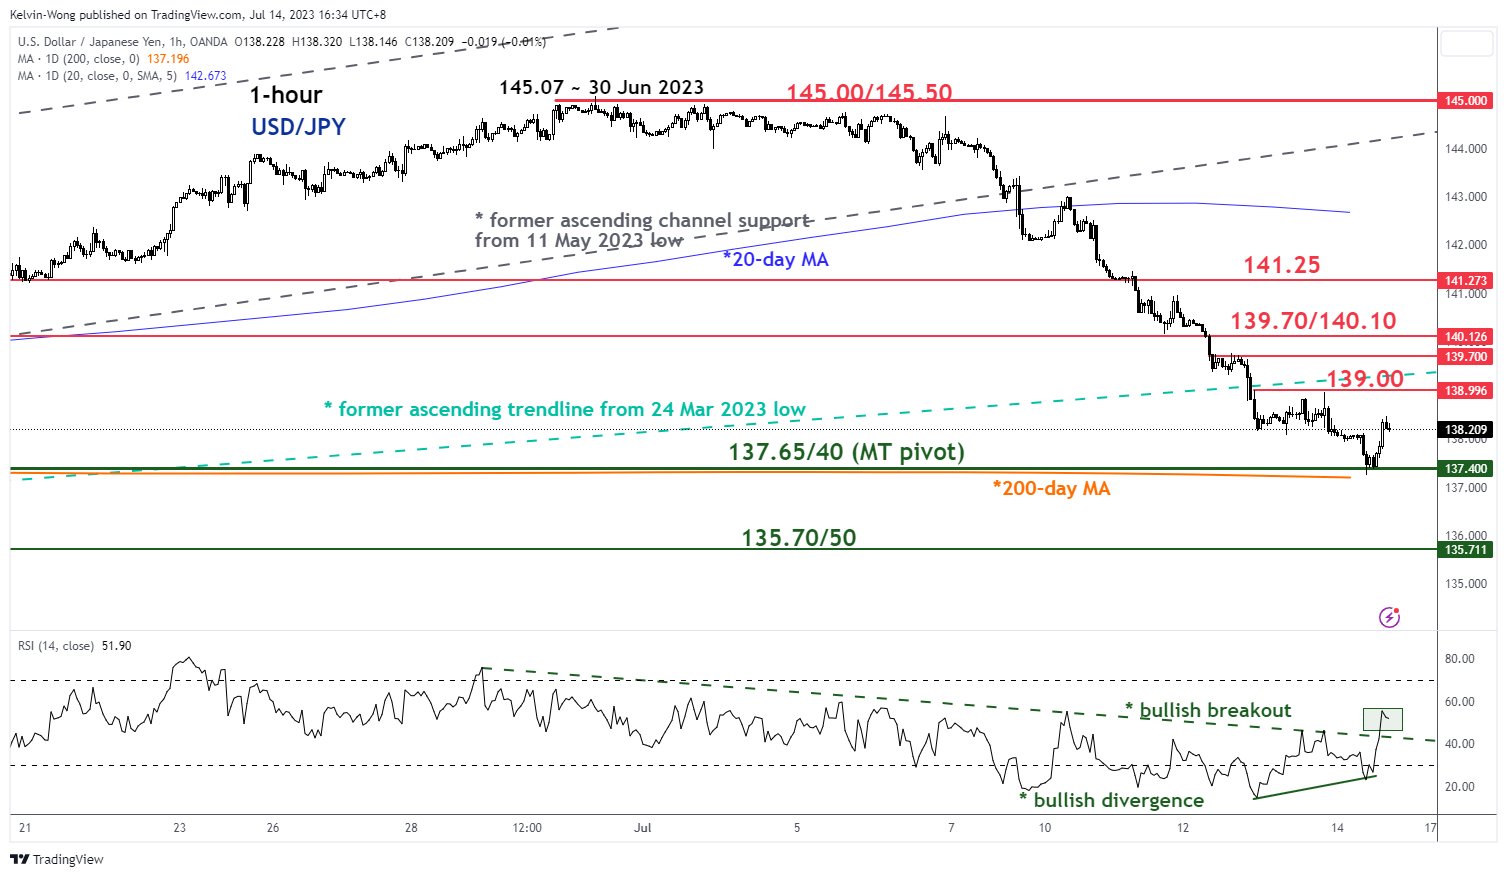
Fig 2: US/JPY minor short-term trend as of 14 Jul 2023 (Source: TradingView, click to enlarge chart)
The hourly RSI oscillator has flashed out another bullish divergence signal at its oversold region and just staged a bullish breakout above a key parallel descending resistance at the 43 level. These observations suggest the recent downside momentum has abated.
Watch the 137.65/40 key medium-term pivotal support for a potential corrective rebound scenario with the next intermediate resistances coming in at 139.00 and 139.70/140.10 (also the 38.2% Fibonacci retracement of the current decline from the 30 June 2023 high to today’s 14 July intraday low of 137.24).
On the flip side, a break below 137.40 invalidates the corrective rebound to expose the next support at 135.70/50 (the 61.8% Fibonacci retracement of the prior up move from 24 March 2023 low to 30 June 2023 high).
Content is for general information purposes only. It is not investment advice or a solution to buy or sell securities. Opinions are the authors; not necessarily that of OANDA Business Information & Services, Inc. or any of its affiliates, subsidiaries, officers or directors. If you would like to reproduce or redistribute any of the content found on MarketPulse, an award winning forex, commodities and global indices analysis and news site service produced by OANDA Business Information & Services, Inc., please access the RSS feed or contact us at info@marketpulse.com. Visit https://www.marketpulse.com/ to find out more about the beat of the global markets. © 2023 OANDA Business Information & Services Inc.
Latest posts by Kelvin Wong (see all)
- SEO Powered Content & PR Distribution. Get Amplified Today.
- PlatoData.Network Vertical Generative Ai. Empower Yourself. Access Here.
- PlatoAiStream. Web3 Intelligence. Knowledge Amplified. Access Here.
- PlatoESG. Automotive / EVs, Carbon, CleanTech, Energy, Environment, Solar, Waste Management. Access Here.
- BlockOffsets. Modernizing Environmental Offset Ownership. Access Here.
- Source: https://www.marketpulse.com/forex/usd-jpy-technical-torpedoed-down-but-holding-at-200-day-moving-average/kwong
- :has
- :is
- :not
- $UP
- 07
- 1
- 10
- 11
- 13
- 14
- 15 years
- 15%
- 2%
- 20
- 2022
- 2023
- 24
- 25
- 28
- 30
- 40
- 50
- 65
- 7
- 70
- 700
- 8
- a
- abated
- About
- above
- access
- acting
- Action
- actions
- addition
- advice
- advocate
- affiliates
- again
- aggressive
- also
- an
- analysis
- and
- annual
- Another
- any
- ARE
- areas
- around
- AS
- asian
- At
- author
- authors
- avatar
- average
- award
- away
- BAND
- Bank
- bank of japan
- Bank of Japan (BoJ)
- basis
- bearish
- before
- below
- bias
- boj
- Bonds
- Bounce
- Box
- Break
- breakout
- Broke
- Bullish
- bullish divergence
- business
- but
- buy
- by
- caught
- challenged
- Chart
- click
- COM
- combination
- coming
- commented
- Commodities
- conducted
- Connecting
- contact
- content
- control
- courses
- Current
- curve
- daily
- day
- Days
- December
- decision
- Decline
- Directors
- Divergence
- down
- downside
- Earlier
- Elliott
- enlarge
- Ether (ETH)
- exchange
- expecting
- experience
- expert
- Fashion
- Fibonacci
- financial
- Find
- firstly
- five
- Flip
- flow
- Flows
- For
- Forecast
- foreign
- foreign exchange
- forex
- formed
- Former
- found
- from
- fund
- fundamental
- General
- Global
- global markets
- Government
- government bonds
- Have
- he
- High
- Highlighted
- hold
- holding
- HTTPS
- if
- impending
- in
- Inc.
- Increases
- indicates
- Indices
- inflation
- information
- interest
- Interest Rates
- Intermediate
- investment
- IT
- ITS
- Japan
- Japanese
- JGB
- July
- june
- just
- Kelvin
- Key
- Last
- latest
- Level
- levels
- like
- likely
- local
- loss
- Low
- Macro
- make
- managed
- March
- Market
- market outlook
- market research
- MarketPulse
- Markets
- max-width
- May..
- Media
- meeting
- minor
- Momentum
- Monetary
- Monetary Policy
- more
- move
- moving
- moving average
- necessarily
- negative
- negative interest rates
- news
- next
- November
- numerous
- Odds
- of
- officers
- official
- on
- only
- Opinions
- or
- our
- out
- Outcome
- Outlook
- over
- Parallel
- passionate
- Pattern
- perspectives
- photo
- pivotal
- Place
- plato
- Plato Data Intelligence
- PlatoData
- please
- points
- policy
- positioning
- positive
- Posts
- potential
- previously
- price
- PRICE ACTION
- Prior
- Produced
- programme
- providing
- published
- purposes
- raise
- Rates
- reached
- rebound
- recap
- recent
- record
- recorded
- region
- released
- report
- Reported
- research
- Resistance
- retail
- retracement
- Reversal
- Risen
- Risk
- rounds
- rsi
- rss
- same
- scenario
- Securities
- sell
- sell-off
- senior
- service
- Services
- session
- sharing
- shed
- shift
- short-term
- side
- Sight
- Signal
- since
- Singapore
- site
- solution
- Source
- specializing
- started
- stock
- Stock markets
- Strategist
- suggest
- support
- surprise
- Swing
- Technical
- Technical Analysis
- ten
- that
- The
- their
- There.
- These
- this
- this week
- thousands
- time
- to
- today
- today’s
- TONE
- Traders
- Trading
- TradingView
- Training
- Trend
- Turned
- two
- unique
- upcoming
- us
- USD/JPY
- using
- v1
- Visit
- Wave
- week
- weekly
- WELL
- which
- winning
- with
- wong
- worse
- Worst
- would
- writing
- years
- Yield
- yield curve
- yield curve control
- you
- zephyrnet