- The USD/TRY is rising by 0.45% to 27.11.
- The CBRT hiked rates to 30% as expected.
- Due to the Fed’s hawkish pause, US yields continue to rise, pushing the pair to the upside.
In Thursday’s session, the USD/TRY gained more ground and broke the 27.00 barrier while investors digested the fresh Central Bank of the Republic of Türkiye (CBRT) and Federal Reserve (Fed) decisions.
On the TRY’s side, the CBRT hiked rates by 500 bps to 30% and reflected the urgency of Turkish policymakers to fight its double-digit inflation, which rose above 58% YoY last month. It’s worth noting that the bank started a new tightening cycle in June after years of an accommodative policy. Turkish leaders refrained from hiking rates to battle inflation, which made the Lira lose nearly 78% of its value against the US Dollar and the country seems to be suffering the effects of “doing too little”.
On the USD side, the US Federal Reserve (Fed) decided on Wednesday to hold the federal funds rate at the 5.25% to 5.5% range, consistent with market expectations. The Fed’s policy statement acknowledged the ongoing solid pace of economic growth while recognising a moderation in job gains, but remained robust. Furthermore, the revised Summary of Economic Projections (SEP) or dot plot revealed policymakers are anticipating a single 25 basis points rate increase before the year’s end and virtually delayed rate cuts into September 2024.
As a reaction, US yields are seeing gains across the curve and stand at multi-year highs, which explains the strength of the USD and the pair’s upward movements. The 10-year rate rose to 4.46%, while the 2- and 5-year yields stood at 5.16% and 4.62%.
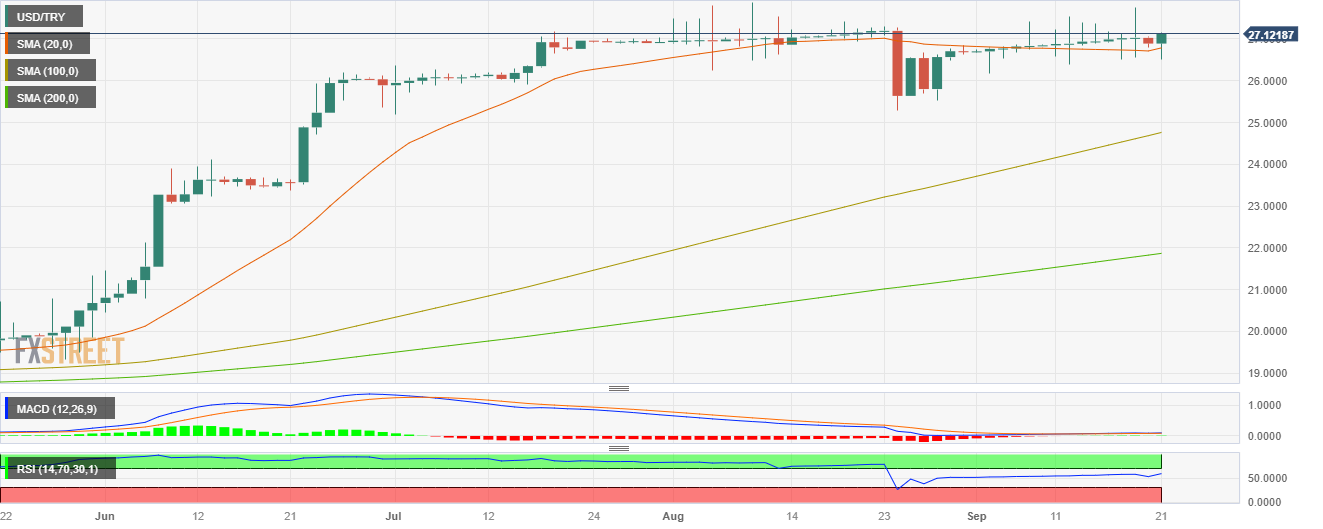
USD/TRY Levels to watch
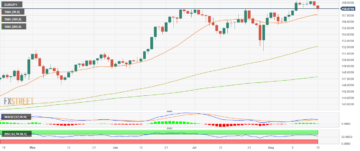
Based on the daily chart, the USD/TRY exhibits a bullish outlook for the short term. The Relative Strength Index (RSI) and Moving Average Convergence Divergence (MACD) remain in positive territory, with the RSI above its midline and showing a northward slope. The MACD is also displaying green bars, indicating a strengthening bullish momentum. Furthermore, the pair is above the 20-, 100- and 200-day Simple Moving Average (SMA), indicating a favourable position for the bulls in the bigger picture.
On the upside, the first target stands near 27.20, while on the downside is the 20-day SMA at 26.80.
USD/TRY Daily Chart
- SEO Powered Content & PR Distribution. Get Amplified Today.
- PlatoData.Network Vertical Generative Ai. Empower Yourself. Access Here.
- PlatoAiStream. Web3 Intelligence. Knowledge Amplified. Access Here.
- PlatoESG. Carbon, CleanTech, Energy, Environment, Solar, Waste Management. Access Here.
- PlatoHealth. Biotech and Clinical Trials Intelligence. Access Here.
- Source: https://www.fxstreet.com/news/usd-try-rises-above-2700-amid-rising-usd-yields-cbrt-hike-202309212056
- :is
- 11
- 20
- 2024
- 25
- 26
- 27
- 500
- 80
- a
- above
- acknowledged
- across
- After
- against
- also
- Amid
- an
- and
- anticipating
- ARE
- AS
- At
- average
- Bank
- barrier
- bars
- based
- basis
- Battle
- BE
- before
- bigger
- Bullish
- Bulls
- but
- by
- CBRT
- central
- Central Bank
- Chart
- consistent
- continue
- Convergence
- country
- curve
- cuts
- cycle
- daily
- decided
- decisions
- Delayed
- displaying
- Divergence
- doing
- Dollar
- DOT
- downside
- Economic
- Economic growth
- effects
- end
- exhibits
- expectations
- expected
- Explains
- Fed
- Federal
- Federal Funds Rate
- federal reserve
- fight
- First
- For
- fresh
- from
- funds
- Furthermore
- gained
- Gains
- Green
- Ground
- Growth
- Hawkish
- Highs
- Hike
- hiking
- hold
- HTTPS
- in
- Increase
- index
- indicating
- inflation
- into
- Investors
- IT
- ITS
- Job
- june
- Last
- leaders
- levels
- lira
- little
- lose
- MACD
- made
- Market
- moderation
- Momentum
- Month
- more
- movements
- moving
- moving average
- multi-year
- Near
- nearly
- New
- noting
- of
- on
- ongoing
- or
- Pace
- pair
- pause
- picture
- plato
- Plato Data Intelligence
- PlatoData
- points
- policy
- policymakers
- position
- positive
- projections
- Pushing
- range
- Rate
- Rates
- reaction
- recognising
- reflected
- relative
- relative strength index
- Relative Strength Index (RSI)
- remain
- remained
- Republic
- Reserve
- Revealed
- Rise
- Rises
- rising
- robust
- ROSE
- rsi
- s
- seeing
- seems
- September
- session
- Short
- showing
- side
- Simple
- single
- Slope
- SMA
- solid
- stand
- stands
- started
- Statement
- strength
- strengthening
- suffering
- SUMMARY
- Target
- term
- territory
- that
- The
- the Fed
- The US Federal Reserve
- tightening
- to
- too
- Turkish
- Türkiye
- Upside
- upward
- urgency
- us
- US Dollar
- US Federal
- us federal reserve
- US yields
- USD
- value
- virtually
- Wednesday
- which
- while
- with
- worth
- year
- years
- yields
- zephyrnet