USD
- The Fed left interest rates unchanged as
expected at the last meeting and dropped the tightening bias in the statement. - The US CPI and
the US PPI beat
expectations for the second consecutive month. - The NFP report beat
expectations on the headline number, but the unemployment rate and the average
hourly earnings missed notably. Moreover, the US Jobless Claims
yesterday beat expectations across the board with a big positive revision to
Continuing Claims. - The latest US ISM
Manufacturing PMI missed expectations by a big margin
remaining in contraction with the US ISM Services
PMI
following suit but holding on in expansion. - The US Retail Sales missed
expectations across the board although the data improved from the prior month. - The market expects the first rate cut in June.
CAD
- The BoC left interest rates unchanged at
5.00% as expected stating that further easing in underlying inflation is needed. - The latest Canadian CPI missed expectations across the
board with the underlying inflation measures falling. - On the labour market side, the latest report beat
expectations but we saw a fall in wage growth which is something that the BoC
is watching closely. - The Canadian PMIs improved in
January although they remain both in contractionary territory. - The market expects the first rate
cut in June.
USDCAD Technical Analysis –
Daily Timeframe
USDCAD Daily
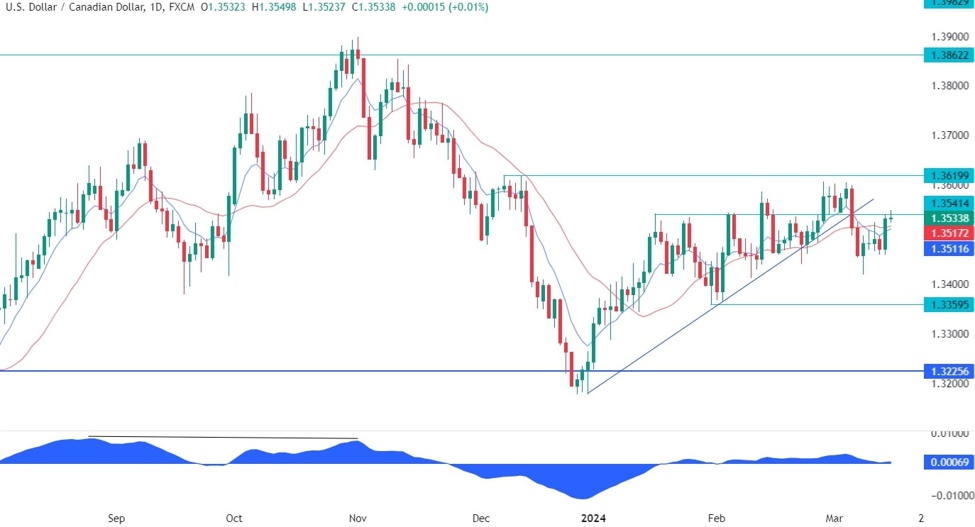
On the daily chart, we can see that USDCAD pulled
back into a key resistance level at
1.3540 following the strong US data release. This is where we can expect the
sellers to step in with a defined risk above the level to position for a drop
into the 1.3360 level. The buyers, on the other hand, will want to see the
price breaking higher to invalidate the bearish setup and position for a rally
into the 1.3620 level.
USDCAD Technical Analysis –
4 hour Timeframe
USDCAD 4 hour
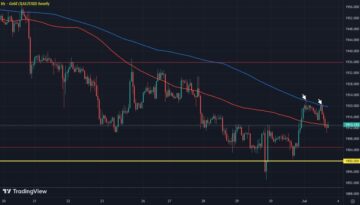
On the 4 hour chart, we can see that we can also
find the 61.8% Fibonacci retracement level
around the resistance level for confluence. We can
also notice that the price is a bit overstretched as depicted by the distance
from the blue 8 moving average. In such
instances, we can generally see a pullback into the moving average or some
consolidation before the next move.
USDCAD Technical Analysis –
1 hour Timeframe
USDCAD 1 hour
On the 1 hour chart, we can see more
closely the recent price action and we can see that around the 4-hour 8 moving
average we have a support zone on this timeframe with the 38.2% Fibonacci
retracement level for confluence. If the price falls from the resistance, we
can expect the buyers to step in around the support with a defined risk below
it to position for a break above the 1.3540 resistance with a better risk to
reward setup. The sellers, on the other hand, will want to see the price
breaking lower to increase the bearish bets into new lows.
Upcoming Events
Today we conclude the week with the US Industrial
Production data and the University of Michigan Consumer Sentiment survey.
- SEO Powered Content & PR Distribution. Get Amplified Today.
- PlatoData.Network Vertical Generative Ai. Empower Yourself. Access Here.
- PlatoAiStream. Web3 Intelligence. Knowledge Amplified. Access Here.
- PlatoESG. Carbon, CleanTech, Energy, Environment, Solar, Waste Management. Access Here.
- PlatoHealth. Biotech and Clinical Trials Intelligence. Access Here.
- Source: https://www.forexlive.com/technical-analysis/usdcad-technical-analysis-we-are-at-a-key-resistance-20240315/
- :is
- :where
- 1
- 2%
- 4
- 5
- 8
- a
- above
- across
- Action
- also
- Although
- analysis
- and
- ARE
- around
- AS
- At
- average
- back
- bearish
- beat
- before
- below
- Bets
- Better
- bias
- Big
- Bit
- Blue
- board
- BoC
- both
- Break
- Breaking
- but
- buyers
- by
- CAN
- Canadian
- Chart
- claims
- closely
- conclude
- confluence
- consecutive
- consolidation
- consumer
- consumer sentiment
- continuing
- contraction
- Cut
- daily
- data
- defined
- depicted
- distance
- Drop
- dropped
- Earnings
- easing
- expansion
- expect
- expectations
- expected
- expects
- Fall
- Falling
- Falls
- Fed
- Fibonacci
- Find
- First
- following
- For
- from
- further
- generally
- Growth
- hand
- Have
- headline
- higher
- holding
- hour
- HTTPS
- if
- improved
- in
- Increase
- industrial
- inflation
- instances
- interest
- Interest Rates
- into
- IT
- January
- jpg
- june
- Key
- key resistance
- Last
- latest
- Level
- lower
- Lows
- manufacturing
- Margin
- Market
- measures
- meeting
- Michigan
- missed
- Month
- more
- Moreover
- move
- moving
- moving average
- needed
- New
- next
- notably
- Notice..
- number
- of
- on
- or
- Other
- plato
- Plato Data Intelligence
- PlatoData
- pmi
- position
- positive
- price
- PRICE ACTION
- Prior
- Production
- pullback
- rally
- Rate
- Rates
- recent
- release
- remain
- remaining
- report
- Resistance
- retail
- retracement
- Reward
- Risk
- saw
- Second
- see
- Sellers
- sentiment
- Services
- setup
- side
- some
- something
- Statement
- stating
- Step
- strong
- such
- Suit
- support
- Survey
- Technical
- Technical Analysis
- territory
- that
- The
- they
- this
- tightening
- timeframe
- to
- unchanged
- underlying
- unemployment
- unemployment rate
- university
- University of Michigan
- University of Michigan Consumer Sentiment
- us
- wage
- want
- watching
- we
- week
- which
- will
- with
- yesterday
- zephyrnet
- zone