First introduced by Chester Keltner in his 1960’s book “How to Make Money in Commodities”, Keltner Channels have become a popular trading indicator and a pillar in the art of technical analysis.
Keltner channels are often compared to Bollinger Bands as they are both trend following indicators used to identify reversals via channel breakouts & channel direction. Additionally, each volatility gauging tool can be used to identify overbought & oversold conditions. The principal difference between the two indicators is Bollinger Bands are created using the Standard Deviation of the instrument, while Keltner Channels use the Average True Range (ATR).
Watch the following quick video tutorial to see the Keltner Channels in action:
Under the Hood
Keltner Channels are plotted on 3 lines:
- Midline
- Upper Band
- Lower Band
The foundation of the indicator is the midline (White), which defaults to a 10 period Simple Moving Average (SMA). The upper and lower bands “offset” the SMA by the difference between the high and low of the previous bars, also known as the Average True Range. The offset multiplier for Keltner Channels defaults to 1.5 in NinjaTrader. An offset multiplier of 1.5 indicates that the upper and lower bands will be plotted 1.5 times the instruments’ previous bars ATR.
Both the offset multiplier and the SMA period are configurable within the indicator properties menu. The higher the multiplier, the wider the channel. A smaller multiplier will result in a narrower channel.
The image below features the default Keltner Channel with an offset of 1.5 (Blue) plus additional channels with offsets of 2 (Red) and 2.5 (Orange). Understanding the nature of the instrument you are trading will help determine the ideal multiplier and SMA period.

Interpretation
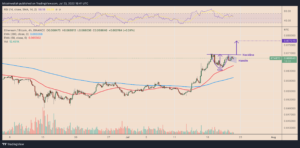
Price action that breaches the bands of a Keltner Channel warrant attention as they could prelude strong directional moves. A break above the upper channel symbolizes strong buying power in the market, while a dip below the lower channel can be interpreted as just the opposite.
Generally speaking, price action should trade near the upper bands, with an occasional touch or breach in an upward trending market. The same holds true on the lower band in downward trending markets.

The above image illustrates the behavior of Keltner Channels when plotted on a 5-minute Gold Futures chart. Utilizing the X-Region drawing tool, the red and green shaded areas represent channel breaches for both lower and upper bands. Once the channel breaches have been identified, traders can determine short-term market trends and potential areas for entry and exit orders.
Before incorporating Keltner channels in a live trading environment, practice in a simulated environment to determine the ideal settings for the SMA & offset.
Get Started with NinjaTrader
NinjaTrader supports more than 500,000 traders worldwide with a powerful and user-friendly trading platform, discount futures brokerage and world-class support. NinjaTrader is always free to use for advanced charting & strategy backtesting through an immersive trading simulator.
Download NinjaTrader’s award-winning trading platform and get started with a free trading demo with real-time market data today!
Source: https://ninjatrader.com/blog/use-keltner-channels-to-identify-trend-direction/
- &
- 000
- Action
- Additional
- analysis
- Art
- bars
- breach
- breaches
- Buying
- channels
- content
- data
- Discount
- Environment
- Exit
- Features
- Foundation
- Free
- Futures
- Gold
- Green
- High
- HTTPS
- identify
- image
- immersive
- Market
- Market Trends
- Markets
- money
- moves
- Near
- offset
- orders
- Pillar
- platform
- Popular
- power
- powerful
- price
- Principal
- range
- real-time
- started
- Strategy
- support
- Supports
- Technical
- Technical Analysis
- tool
- touch
- trade
- Traders
- Trading
- trending
- Trends
- tutorial
- Video
- Volatility
- within
- worldwide
- youtube