VeChain targeted a rise above $0.015 to flip bear market conditions. A number of factors contributed to Ethereum Classic’s 77% loss in value in just two weeks. Finally, MATIC’s bull run could depend on a rise above $1.77-resistance.
VeChain [VET]
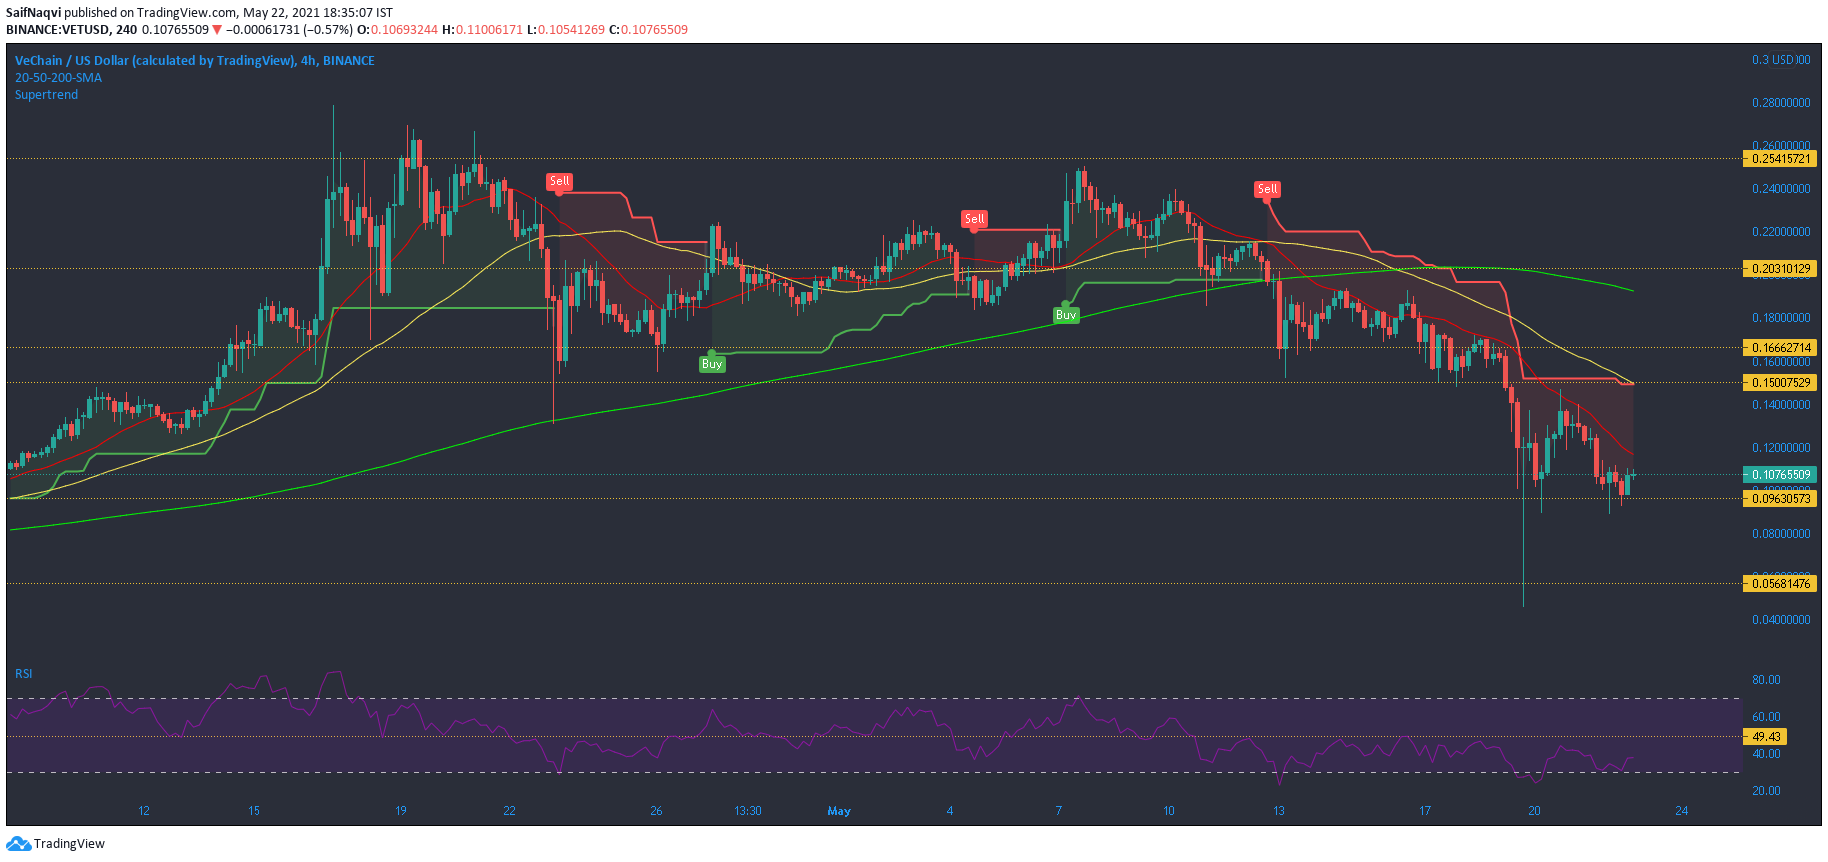
Source: VET/USD, TradingView
VeChain saw a 31% price hike during the rapid buy phase on May 20 but retraced back to $0.096 after investors locked in their profits. On the 4-hour chart, VET traded below its 20-SMA (red) which acted as a resistance line. Even in case of a breakout, gains would likely be limited to $0.015 and 50-SMA (yellow). The Supertrend Indicator also placed a buy signal at this mark.
However, market dynamics would shift in favor of bulls in case of a break above $0.015. This would open the doors for a 26% rally towards the 200-SMA at $0.19. On RSI, traders should be on the lookout for a break above 49-50 as this could trigger a bullish reversal.
Ethereum Classic [ETC]

Source: ETC/USD, TradingView
Ethereum Classic’s high of $175 to a low of $39.62 represented losses of 77.6% in just about two weeks. Several developments led to this downwards spiral. Bearish divergence on ETC’s previous bull indicated weakening, while a descending triangle breakdown (not shown) resulted in a sharp sell-off. The recent crypto-dump only accentuated losses over the last couple of days. A region of support was found at $54.4 but a breakout above $65 seemed unlikely over the short term.
RSI traded in bearish territory but a rise above the upper sloping trendline could trigger a swift bounce back. However, strong capital inflows according to CMF could be the key to avoid another dip.
MATIC
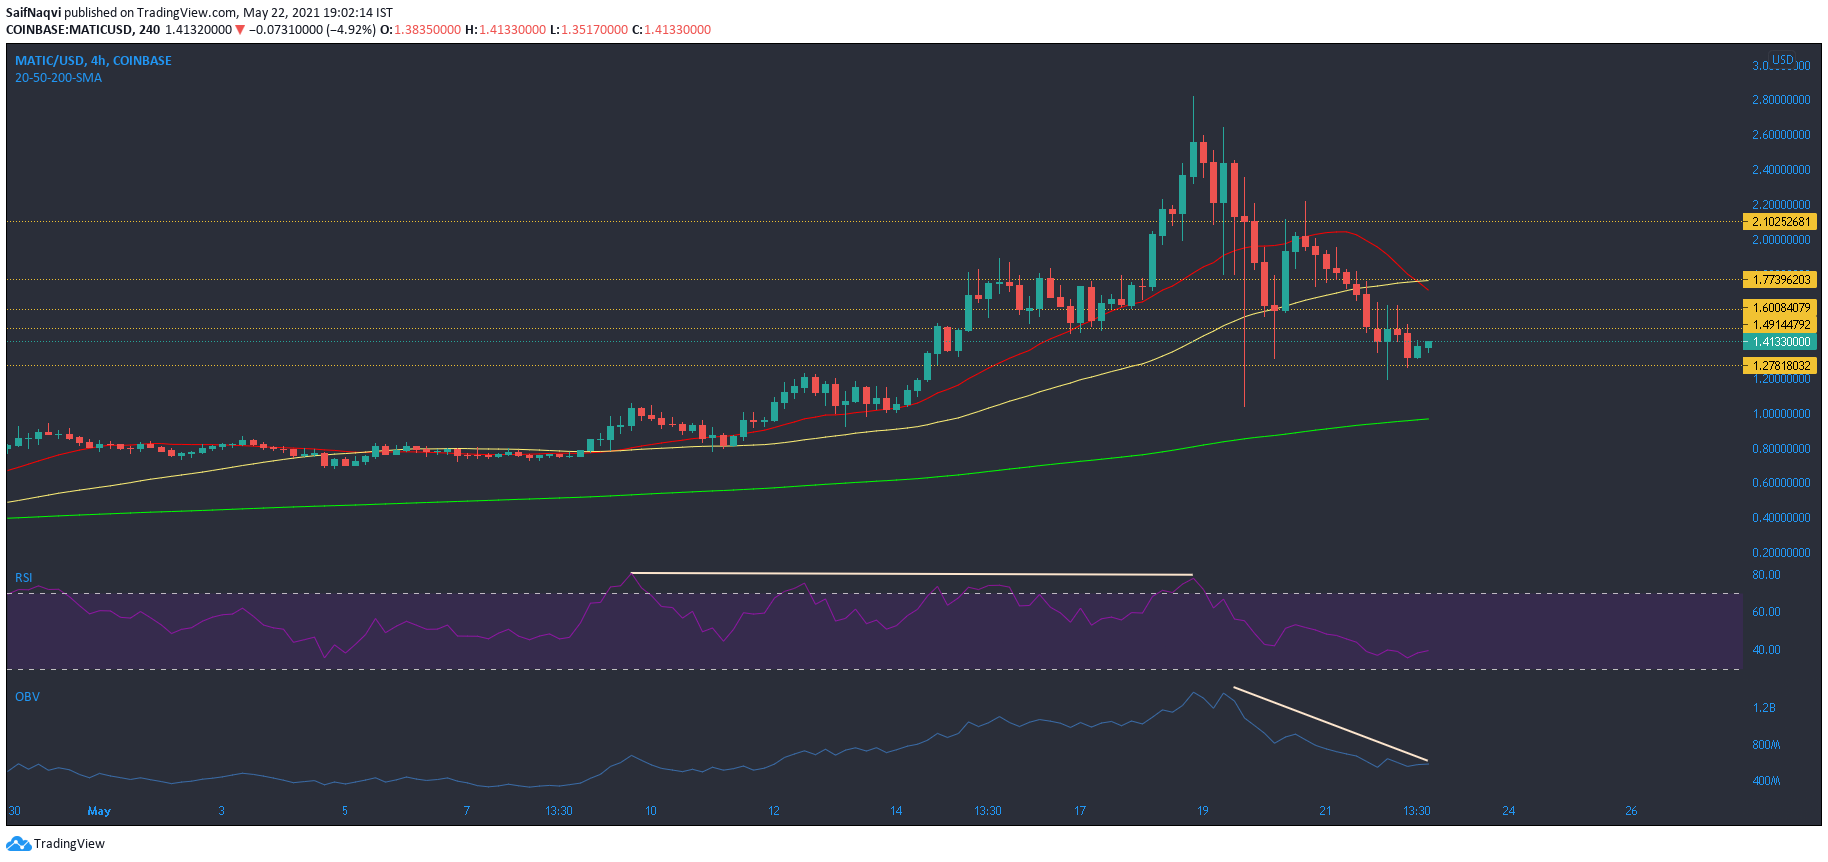
Source: MATIC/USD, TradingView
Since MATIC was one of the premier alts during the rapid buy phase on May 20, its retracement over the last 24 hours was quite a surprise. This period saw MATIC drop from a high of $2.2 to a low of $1.26. Losses were finally cushioned around this level and some buying was noted on the 4-hour chart.
A key area lay above $1.77 and a breakout could trigger another price hike. Coincidently, this zone also clashed with the 20-SMA (red) and 50-SMA (yellow). Prior to the recent crypto sell-off, MATIC’s RSI touched overbought zone multiple times and a correction was overdue. OBV’s downtrend suggested profit taking after steady buying between April 26-May 18.
Source: https://ambcrypto.com/vechain-ethereum-classic-matic-price-analysis-22-may/