TL;DR Breakdown
- Today’s VeChain price analysis has put on a bullish outlook.
- VET/USDT price has found nearest support at $0.124.
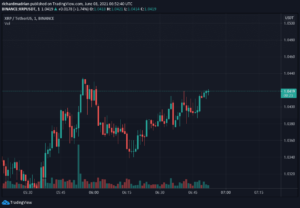
- The price moved from 0.137 to 0.145 overnight, although unable to breach resistance.
- Major resistance is currently located at $0.144 price levels.
VeChain has been quite profitable for the last two days as the price surged from $0.115 on 31st August to $0.145 on 2nd September, which is quite an amazing rally. Along with VET, Coin98, MATIC, and DOT have also seen a lot of bullish action. This bullish atmosphere had been absent from the crypto industry for most of May, June, and July.
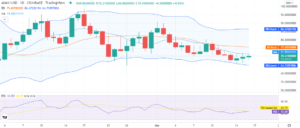
The green candles in the 4-hour VET/USDT price chart reveal that, indeed, VET is a profitable investment. For the current scenario, VeChain is trading at $0.144, which is an area of resistance. Another resistance is situated at $0.164. After breaking out from the earlier resistance of $0.123 levels, support has been formed at $0.125. After such high gains, it is possible that the bulls get exhausted unless Bitcoin makes its move.
Bitcoin is up by over 2.5 percent and is trading above $49k. It is expected that the BTC/USDT pair will again try to breach the strong resistance that is present at $50k. If Bitcoin can successfully rise further and breach this resistance, we might see a bullish surge for VET/USDT and a successful breakout from its current resistance levels.
Technical indicators on VET/USD 4-hour chart: VeChain price analysis bullish?
A comprehensive VeChain price analysis based on the Bollinger Bands and the position of 100-day and 50-day Moving Averages can be made. The Bollinger Bands have expanded as we have seen a price breakout from the upper end of the Bands. This shows that the price action for VET/USDT since the past few days has been nothing but upwards.
Also, the price action is present above the key Moving Averages on the 4-hour chart, i.e., the 50-day and the 100-day Moving Averages. This bullish growth was fuelled by an increase in the trading volumes by over 5.23 percent, indicating a rising interest for investors in VeChain. All of this is clearly visible in the 4-hour chart below.

However, in our VeChain price analysis, we will use the MACD indicator and the RSI indicator to indicate the bulls’ position and if a further increase will follow. The RSI indicator, as visible from the 4-hour chart below, has a reading of 75. This is a region wherein the bulls have completely taken charge, and now, the coin is at an overbought point. This is the best time to sell VeChain and wait for lower prices, according to the indicator.
The RSI is trading with a positive gradient, but if the attempt to breach the resistance at $0.144 fails, we might see a price retracement towards the $0.125 support level, and the RSI will turn bearish. Coming to the MACD indicator, the MACD line or the blue line in the chart below has risen above the orange line or the signal line, which is the indicator for a bullish scenario. Therefore, a bullish situation might be possible as the histogram is also full of green candles.

VeChain price analysis: Conclusion
A historical achievement was experienced by VeChain today, as the VeChain Foundation revealed on their Twitter handle:
Thor mainnet has now processed more than 10 million blocks pushing the $VET token to climb over 60% in the past month as momentum builds.
With such achievements, a price surge was inevitable for VeChain. It is possible that VET/USDT might maintain support and strive for higher prices in the coming days.
Disclaimer. The information provided is not trading advice. Cryptopolitan.com holds no liability for any investments made based on the information provided on this page. We strongly recommend independent research and/or consultation with a qualified professional before making any investment decisions.Source: https://api.follow.it/track-rss-story-click/v3/tHfgumto13DRBYcd6c4EEarkJyTkC_2b
- Action
- advice
- All
- analysis
- AREA
- AUGUST
- bearish
- BEST
- Bitcoin
- breach
- breakout
- Bullish
- Bulls
- charge
- Coin
- coming
- crypto
- Crypto Industry
- Current
- data
- follow
- For Investors
- full
- Green
- Growth
- High
- HTTPS
- Increase
- industry
- information
- interest
- investment
- Investments
- Investors
- IT
- July
- Key
- Level
- liability
- Line
- Making
- Matic
- million
- Momentum
- move
- Outlook
- present
- price
- Price Analysis
- price surge
- rally
- Reading
- research
- sell
- successful
- support
- support level
- surge
- time
- token
- Trading
- VeChain
- wait