Published 7 hours ago
Concerning the last three weeks of parabolic recovery in Ethereum price, the daily time frame chart shows the formation of a rounding bottom pattern. In theory, this pattern formation signifies sustained recovery in any asset, providing several entry opportunities for interested traders. Currently, the ETH price is challenging the neckline resistance of this pattern, and here’s how a potential break out from this neckline would influence the coin’s future price.
advertisement
Key Points:
- A bullish breakout from the $1660 resistance sets the Ethereum price for a bullish upswing of 20%
- A bullish crossover between the 50-and-100-day EMA would increase the possibility for extended recovery.
- The intraday trading volume in Ether is $7.13 Billion, indicating a 31% loss.
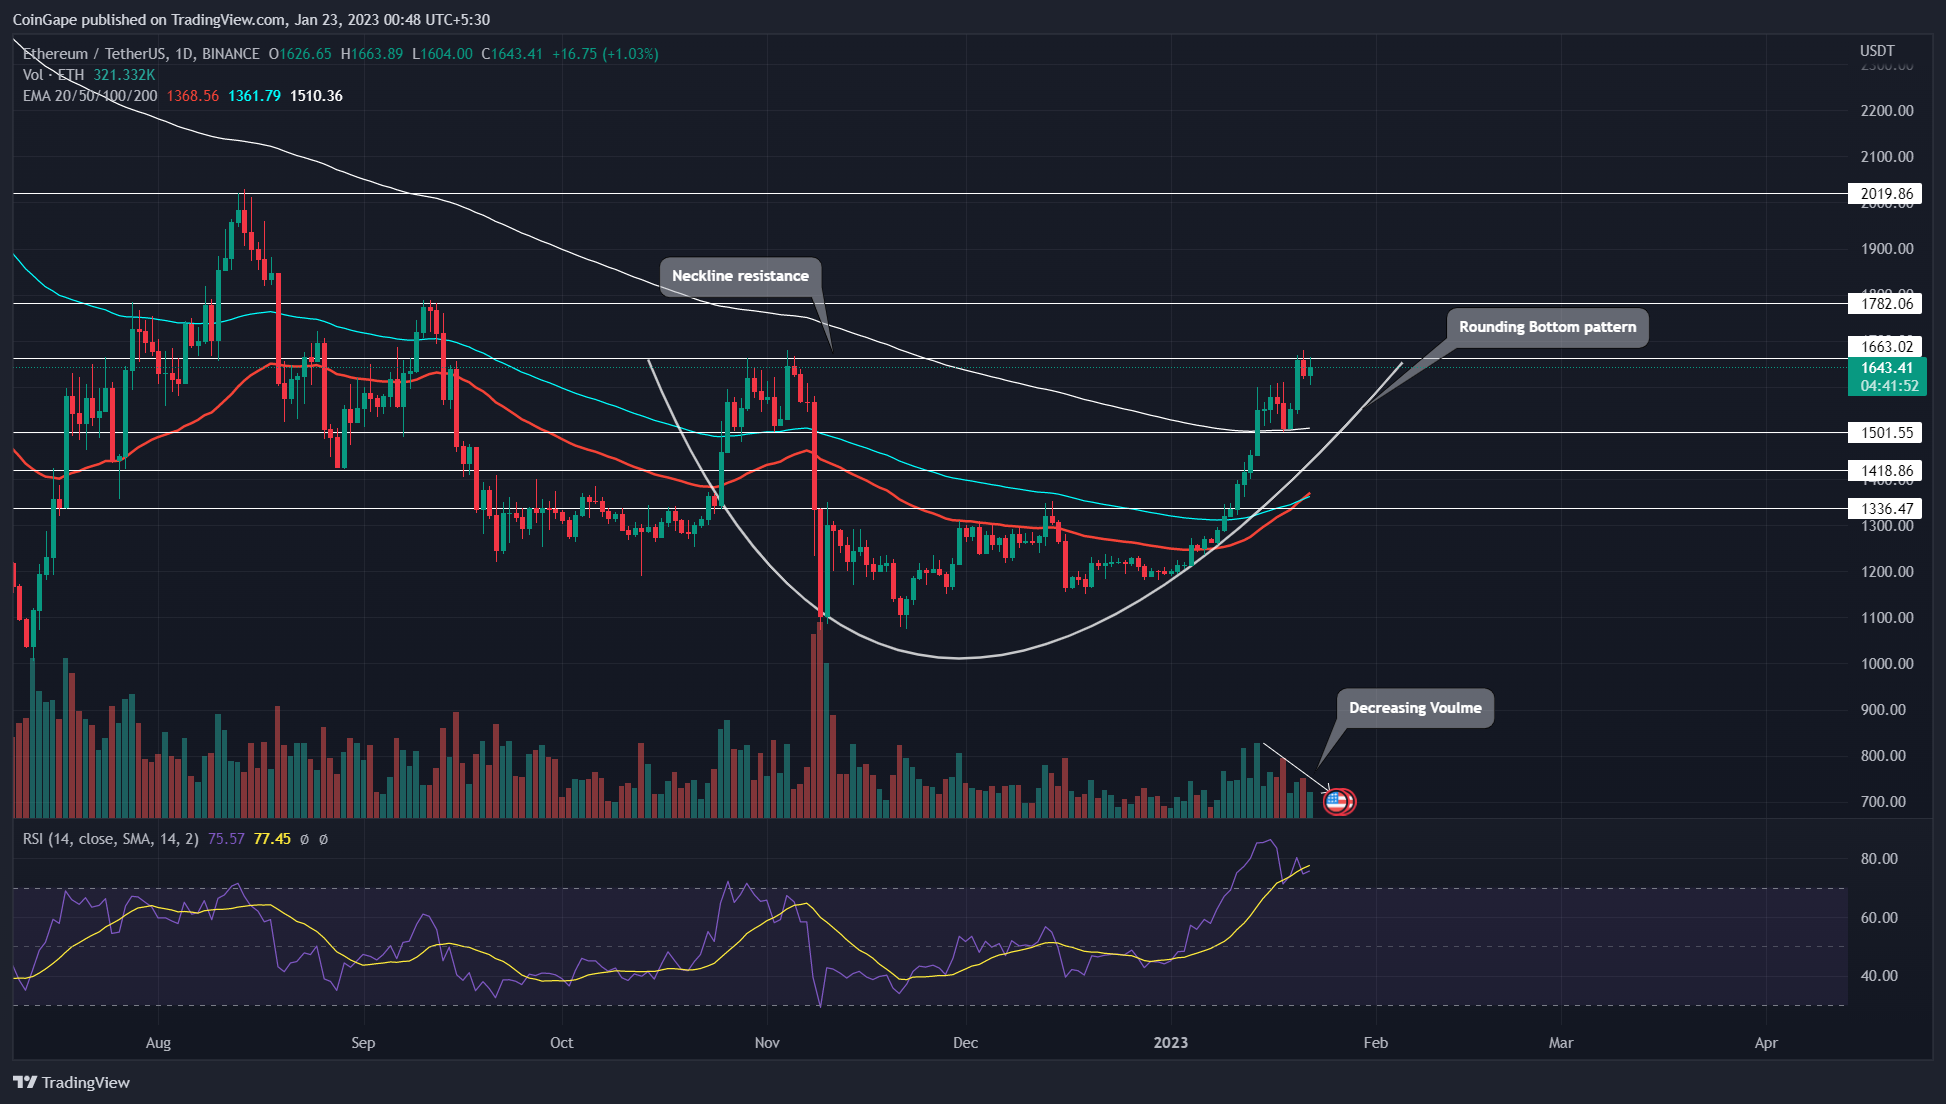
Source- Tradingview
By the press time, the Ethereum price trades at $1655 and is 39% up from January 1st low. However, this week’s volume activity showed the bullish momentum is gradually getting exhausting. Therefore, as the prices were approaching the $1616 monthly barrier, the reducing volume activity indicated weakness in buyers’ conviction.
This divergence between price actions and volume hints at a high possibility for upcoming correction. Thus, if the Ethereum coin price is rejected from the $1660 ceiling, the coin holders could witness a consolidation between the mentioned resistance and $1500 support.
Trending Stories
Anyhow, a minor consolidation or pullback could benefit the Ethereum coin price by recuperating the bullish momentum after an aggressive rally. Moreover, the interested could find pullback entry opportunities near the $1500 or $1420 support levels.
Also Read: CRYPTO TELEGRAM CHANNELS LIST 2023
However, the traders looking for a safer entry could wait for a high volume breakout from $1660 before entering the market. This resistance, also being the neckline of the rounding bottom pattern, could intensify the bullish momentum upon breakout.
Thus, the $1660 breakout good drive the ETH price to $1780, followed by $2020.
Technical Indicator
RSI: the RSI slope reverting from the overbought region indicates the coin price needs to stabilize before the next bull recovery cycle.
advertisement
EMAs: the recently reclaimed 200-day EMA could offer strong support at the 1500 level. Moreover, the other EMA’s(20, 50, and 100) would do the same job during deeper correction.
Ethereum Coin Price Intraday Levels-
- Spot rate: $1648
- Trend: Bullish
- Volatility: Low
- Resistance level- $1660 and $1782
- Support level- $1500 and $1420
Share this article on:
The presented content may include the personal opinion of the author and is subject to market condition. Do your market research before investing in cryptocurrencies. The author or the publication does not hold any responsibility for your personal financial loss.
- SEO Powered Content & PR Distribution. Get Amplified Today.
- Platoblockchain. Web3 Metaverse Intelligence. Knowledge Amplified. Access Here.
- Source: https://coingape.com/markets/volume-action-hints-upcoming-pullback-in-ethereum-price-keep-holding/
- $1500
- 1
- 10
- 100
- 7
- 9
- a
- Action
- actions
- activity
- After
- aggressive
- and
- approaching
- article
- asset
- author
- avatar
- barrier
- Beauty
- before
- being
- benefit
- between
- Billion
- blockchain
- Bottom
- Break
- break out
- breakout
- Brian
- bull
- Bullish
- ceiling
- challenging
- channels
- Chart
- Coin
- Coingape
- COM
- condition
- consolidation
- content
- conviction
- could
- cryptocurrencies
- cryptocurrency
- Currently
- daily
- deeper
- different
- Divergence
- drive
- during
- EMA
- Entertainment
- entry
- ETH
- eth price
- Ether
- Ether (ETH)
- ethereum
- Ethereum Price
- Fashion
- finance
- financial
- Find
- follow
- followed
- formation
- FRAME
- from
- future
- Future Price
- getting
- good
- gradually
- High
- hints
- hold
- holders
- holding
- HOURS
- How
- However
- HTTPS
- in
- include
- Including
- Increase
- indicates
- influence
- interested
- investing
- January
- Job
- journalism
- Keep
- Last
- Level
- levels
- List
- looking
- loss
- Low
- Market
- market research
- mentioned
- minor
- Momentum
- monthly
- Near
- needs
- next
- offer
- Opinion
- opportunities
- Other
- parabolic
- past
- Pattern
- personal
- plato
- Plato Data Intelligence
- PlatoData
- points
- possibility
- potential
- presented
- press
- price
- Prices
- providing
- Publication
- pullback
- rally
- Rate
- Read
- recently
- recovery
- reducing
- region
- research
- Resistance
- responsibility
- reverting
- safer
- same
- Sets
- several
- Share
- Shows
- signifies
- stabilize
- strong
- subject
- support
- support levels
- Telegram
- The
- therefore
- three
- time
- to
- Topics
- Traders
- trades
- Trading
- trading volume
- TradingView
- trending
- upcoming
- variety
- volume
- wait
- weakness
- Weeks
- witness
- working
- would
- written
- years
- Your
- zephyrnet