Trading was quiet on Monday as the markets remained rather nonplused over global inflation and growth dynamics amid ongoing impacts from the pandemic, stimulus, and supply chain disruptions. The Fed remains upbeat on growth while it downplays a sustained increase in price pressures. The data continue to support the former outlook, while the markets remain split over inflation.
For now, there is buy-in regarding the “transitory” nature of the surge in prices as longer dated bond rates are relatively steady even as many price data hit historic highs. But bonds have been sensitive to that data on occasion, where the jump in rates has weighed on Wall Street and especially growth shares. Stocks trimmed losses into the afternoon with the USA100 finishing -0.38% lower, while the USA500 was off -0.25%, with the USA30 -0.16% lower. There’s ongoing uncertainty on when the Fed will start to talk about QE.
Inflation jitters are keeping rates elevated but the renewed worries over Covid cases, particularly in Asia, and their impact on growth are sustaining a cautious tone, amid tightening restrictions in Hong Kong, Singapore and Taiwan, on top of the problems in India and Japan. The US 10-year rate dropped -0.7 bp to 1.64%, while bonds in Australia and New Zealand were under pressure as stock markets rebounded. JPN225 is up 2.4%, despite weaker than expected Q1 GDP estimates. The ASX lifted 0.75, the Nifty 1.3% and Taiwan’s TAIEX, which lost -3% yesterday, bounced back with a gain of 4.9% after the country’s financial stabilisation fund said it was monitoring developments and amid reports showing that foreign investors at least continued to buy into yesterday’s selloff.
After US, Eurozone and Chinese inflation metrics for April came in much hotter than expected and despite central banker warnings, the markets face an even bigger wall of worry. Even though the markets initially regained their poise as investors took central bankers at their word that the jump in prices will prove “transitory”, today the stocks are lacklustre and still struggling as investors keep a watchful eye on virus developments and price data – such as inflation and quarterly GDP – which will be at a premium globally this week, as they might make things more volatile.
In the US, the price components of the manufacturing sentiment surveys will be of interest, along with home price figures. The FOMC minutes are due, but should not alter the view that policy is on hold for “some time.” In the Eurozone, final April CPI and German PPI are the highlights. In the UK, PM Johnson warned the new India Covid variant could delay reopenings. In Asia, regional CPIs and PPIs are slated but attention will also be on the worsening virus situation, especially in hard-hit India.
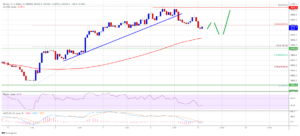
In times of heightened uncertainty such as this one, other than declining stocks we have seen Gold reacting as a proper safe haven and setting its highest level since February, breaking the nearly 1-year descending regression channel. Let’s remember that the yellow metal is often bought by investors as a hedge against inflation.
“Gold ETFs have actually started to pick up again this month, which is positive because the market is reading higher inflation, at least over the short term,” said Stephen Innes, managing partner at SPI Asset Management.
“If the dollar continues to weaken, gold could catch fire, but much of this in Asia is pretty muted. The real key here is how gold is going to perform to London open.”

JPMorgan’s Peters said she expected stock and bond markets to stay “rangebound over the summer” as investors anticipated the US Federal Reserve, the world’s most influential central bank, would start commenting on when it would reduce the $120bn in monthly bond purchases that have boosted financial markets through the pandemic.
The FOMC in particular has not only been rooting for a rise in inflation but has actively participated in helping boost prices via its aggressively accommodative policies. And recent data suggests they may have gotten their wish, and then some. US CPI climbed 0.8% in April and the core surged 0.9%, much hotter than expected. It was the biggest increase in the headline since 2009, and the largest pop in the core since 1981.
As cautioned by the Fed, the 12-month headline index spiked to a 4.2% y/y clip (the biggest since September 2008) and the core rate accelerated to 3.0% y/y (ties the biggest since 1995). Transportation costs were the major culprit, surging 2% thanks to a 10.0% jump in used car prices (which should be temporary), but various other factors (that may not be temporary) contributed, including increases in commodity, housing, and services prices. While the Fed has attributed the climb in y/y inflation largely to “base effects,” the monthly gains also have accelerated in 2021, suggesting an updraft in inflation even if the y/y inflation spike can be partly discounted.
This monthly trend will be closely monitored, especially to see if price pressures become imbedded in inflation expectations.
Click here to access our Economic Calendar
Andria Pichidi
Market Analyst
Disclaimer: This material is provided as a general marketing communication for information purposes only and does not constitute an independent investment research. Nothing in this communication contains, or should be considered as containing, an investment advice or an investment recommendation or a solicitation for the purpose of buying or selling of any financial instrument. All information provided is gathered from reputable sources and any information containing an indication of past performance is not a guarantee or reliable indicator of future performance. Users acknowledge that any investment in Leveraged Products is characterized by a certain degree of uncertainty and that any investment of this nature involves a high level of risk for which the users are solely responsible and liable. We assume no liability for any loss arising from any investment made based on the information provided in this communication. This communication must not be reproduced or further distributed without our prior written permission.
- "
- 2021
- 7
- access
- advice
- All
- April
- asia
- asset
- asset management
- Australia
- Bank
- Biggest
- Bonds
- Boosted
- boosting
- BP
- buy
- Buying
- car
- cases
- Catch
- Central Bank
- chinese
- Commodities
- commodity
- Communication
- continue
- continues
- Costs
- Covid
- data
- delay
- Dollar
- dropped
- Economic
- estimates
- ETFs
- Eurozone
- eye
- Face
- Fed
- Federal
- federal reserve
- financial
- Fire
- fund
- future
- GDP
- General
- Global
- Gold
- Growth
- here
- High
- hold
- Home
- Hong Kong
- housing
- How
- HTTPS
- Impact
- Including
- Increase
- index
- india
- inflation
- information
- interest
- investment
- Investors
- IT
- Japan
- Johnson
- jump
- keeping
- Key
- Level
- liability
- London
- major
- management
- managing partner
- manufacturing
- Market
- Marketing
- Markets
- metal
- Metrics
- Monday
- monitoring
- New Zealand
- open
- Other
- Outlook
- pandemic
- partner
- performance
- policy
- Premium
- pressure
- price
- Products
- Q1
- Rates
- Reading
- reduce
- regression
- Reports
- research
- Risk
- safe
- Safe Haven
- sentiment
- Services
- setting
- Shares
- Short
- Singapore
- split
- start
- started
- stay
- stimulus
- stock
- Stock markets
- Stocks
- street
- supply
- supply chain
- support
- surge
- Taiwan
- temporary
- time
- top
- transportation
- Uk
- us
- users
- View
- virus
- Wall Street
- week