Halving for Bitcoin (BTC) and other crypto assets like Litecoin (LTC) has remained a big catalyst but with less performance from Litecoin (LTC) from the recent halving; there have been increasing concerns for Bitcoin (BTC) halving.
Litecoin saw its price tank after its halving as many experts and analysts speculated a weakening trend of halving ahead of Bitcoin, considering the expectation of an impending bull run.
Bitcoin’s price and other crypto assets like Ethereum (ETH), Binance coin (BNB), and Ripple (XRP) have all suffered a tough week as bears tend to have an advantage over prices.
Ripple’s (XRP) price dominance has dropped dramatically in recent days after news of its success in its lawsuit as the price continues to suffer price decline from its high of $0.93 to $0.66, with the price likely to drop more.
Statistics on Coin360 have shown much influence of bears on the price of major cryptocurrencies, with just a few exceptions performing well heading into a new week with many opportunities on the horizon with these top 5 altcoins (GALA, SHIB, MATIC, INJ, ADA).
The price of Bitcoin (BTC) has remained under the influence of bears as the price struggles to regain bullish price action. With the bears looking to take full advantage of BTC price, the price of BTC needs to reclaim $30,000 to have many bullish opportunities.
If the price of Bitcoin (BTC) breaks below $28,500, acting as strong interest for many long positions, we could see bears driving BTC’s price to a low of $27,500.
On the daily (1D) timeframe, the price of Bitcoin (BTC) trades below the 50-day Exponential Moving Average (EMA) with its daily Relative Strength Index (RSI) looking weak, indicating a bearish scenario for BTC price if the price fails to reclaim $30,000.
With the price of BTC looking bearish, Ethereum (ETH) continues to look bearish likewise, as BTC dominance continues to affect many altcoins.
Ethereum’s (ETH) price continues to hold above key support of $1,820; if the price of ETH closes below this support, we could see the price drop to a low of $1,700, serving as strong support for buy positions.
Despite the uncertainties for Ethereum and Bitcoin, let us pay attention to these top 5 altcoins (GALA, SHIB, MATIC, INJ, ADA) ahead of the new week, as these tokens could perform better than BTC and ETH.
Top 5 Altcoins – Injective Protocol (INJ) Daily (1D) Price Analysis
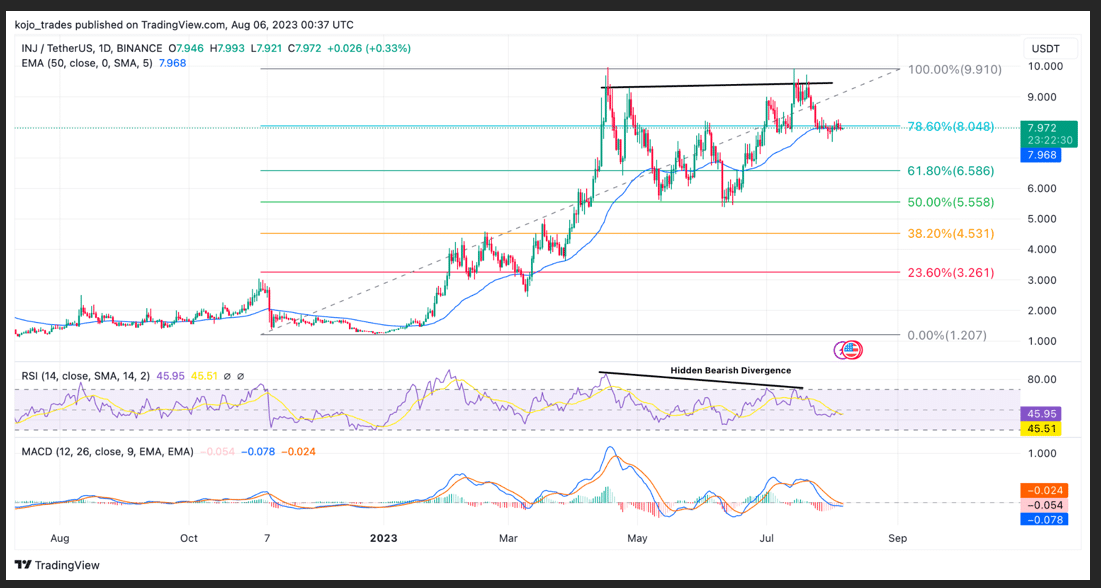
Injective Protocol’s (INJ) inclusion as a top 5 altcoin to watch for the week is no fluke, as this top token has remained a huge player in 2023 as the price of INJ rallied from a low of $1.5 to a high of $9.9 with over 600% gain surpassing the likes of Bitcoin (Bitcoin) and Ethereum (ETH).
The price of INJ rallied to a high of $9.9 and has struggled to break past this region as this has remained at its yearly high, with the price dropping to a region of $6 with bulls still in control.
The price of INJ/USDT has faced several rejections from the high of $9.9 towards $7.9, just above the 50-day EMA, as bulls remain in control of prices.
The region of $7.9 corresponds to the 50-day EMA acting as support for the price of INJ/USDT. If the price of INJ/USDT closes below $7.9, we could see bears push the price of INJ/USDT to a low of $7 and $6.
The Fibonacci Retracement value 61.8% and 50.0% (FIB value 61.8% and 50.0%) correspond to $7 and $6, respectively, acting as support regions and demand zones for buy orders for INJ/USDT.
Although the price action for INJ looks strong, the emergence of hidden bearish divergence for its daily RSI and MACD indicates a trend from bullish to bearish, which still looks healthy for bulls.
The Moving Average Convergence Divergence (MACD) for INJ suggests a change in trend as the price continues to look likely for a downtrend.
Major daily resistance for INJ – $9.9
Major daily support for INJ – $7-$6
MACD – Bearish trend
Daily (1D) Price Analysis For Cardano (ADA)
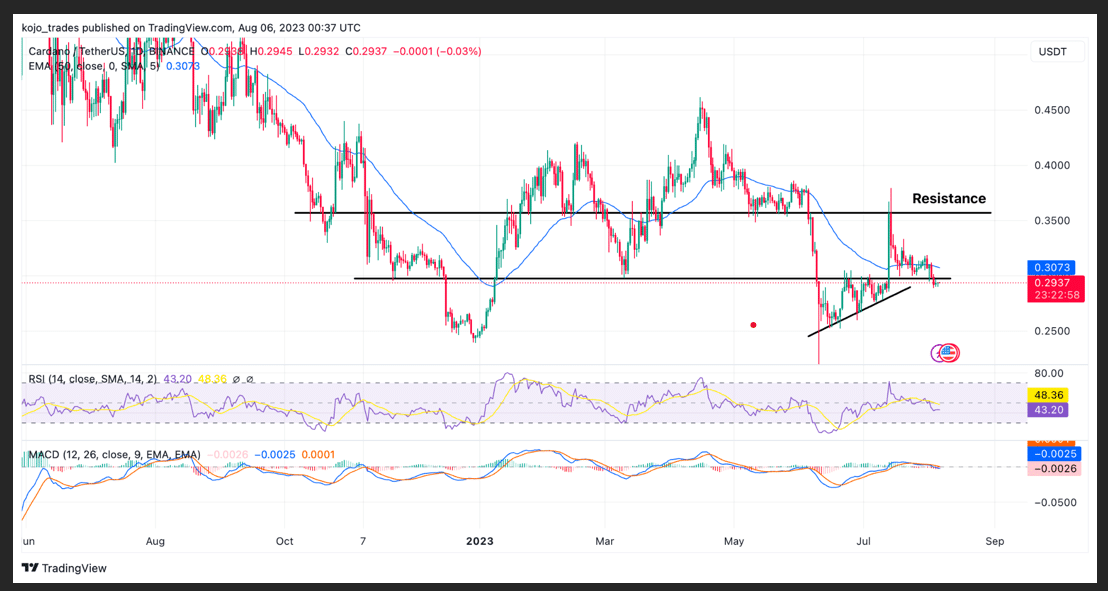
Cardano’s price action has recently struggled as the price got rejected from $0.35 after its bullish price breakout as the price of ADA/USDT continues to drop as bears take control of the price.
The price of ADA failed to close above $0.35, flipping this region into support as the price faced much price rejection by bears as bulls struggled to maintain their initial price rally.
ADA’s price continues to trade below key areas of interest for many bulls as it trades below its daily 50-day EMA, suggesting a bearish trend on the 1D timeframe.
If the price of ADA fails to reclaim the highs of $0.35, we could see the price drop to a low of $0.25 by bears, as this could be a good area for the price to build much momentum for a price rally.
The MACD for ADA on the daily (1D) timeframe indicates a bearish price trend for ADA as the price continues its struggle in a bearish trend.
The price action for ADA on lower and higher timeframes indicates bears are much in control of price as the RSI currently trades below the 50 mark in favor of the bears.
Major daily resistance for ADA – $0.35
Major daily support for ADA – $0.25
MACD – Bearish trend
Shiba Inu (SHIB) Daily Price Analysis
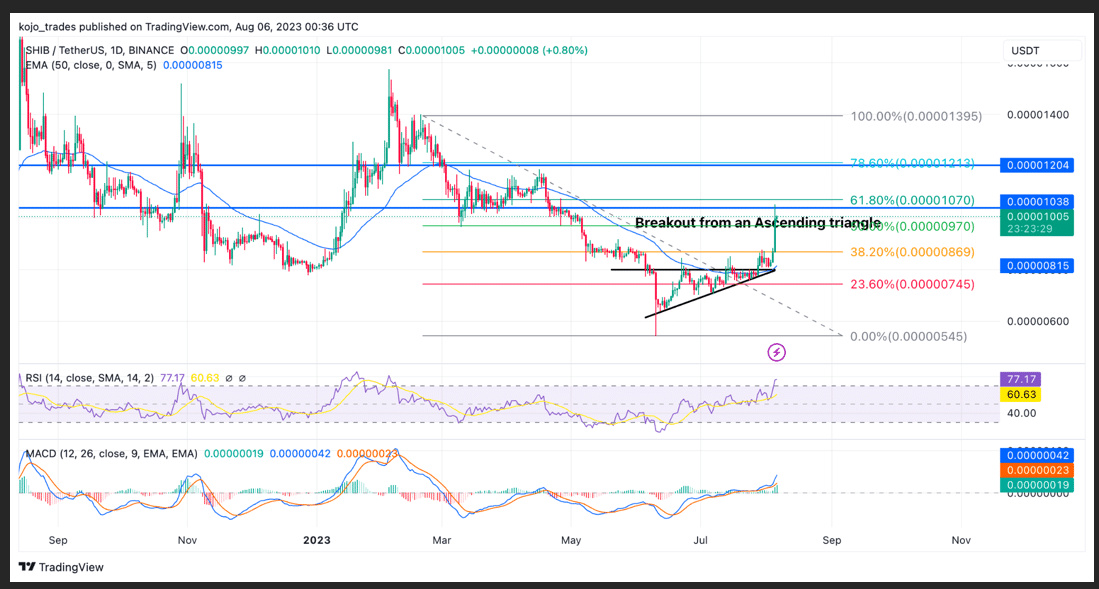
Shiba Inu’s (SHIB) price action remains one of the best price actions for the past few days as the price of SHIB/USDT has shown many bullish signs of price due for a rally.
The price of SHIB/USDT nose-dived to a low of $0.00000600 as price bounced off this region as many bulls dominated price to a high of $0.000000750 as price formed a bullish ascending triangle.
Shiba Inu (SHIB) broke out of its bullish ascending triangle as the price retested its support as price eyed $0.00001. The price actions and indicators all point in one direction for bulls as the price could maintain its rally to a high of $0.00001200.
The price of SHIB/USDT faces its major test of breaking and closing above $0.00001050, corresponding to its 61.8% FIB value.
A break and close above this region for SHIB/USDT on higher timeframes could ignite a bullish price rally to $0.00001200.
MACD and RSI on the daily timeframe for SHIB indicate bullish control of price for SHIB as price eyes new highs ahead of a new week as one of the top 5 altcoins to watch.
Major daily resistance for SHIB – $0.00001050
Major daily support for SHIB – $0.00000850
MACD – Bullish trend
Polygon Matic (MATIC) Price Analysis as a Top 5 Altcoin to Watch
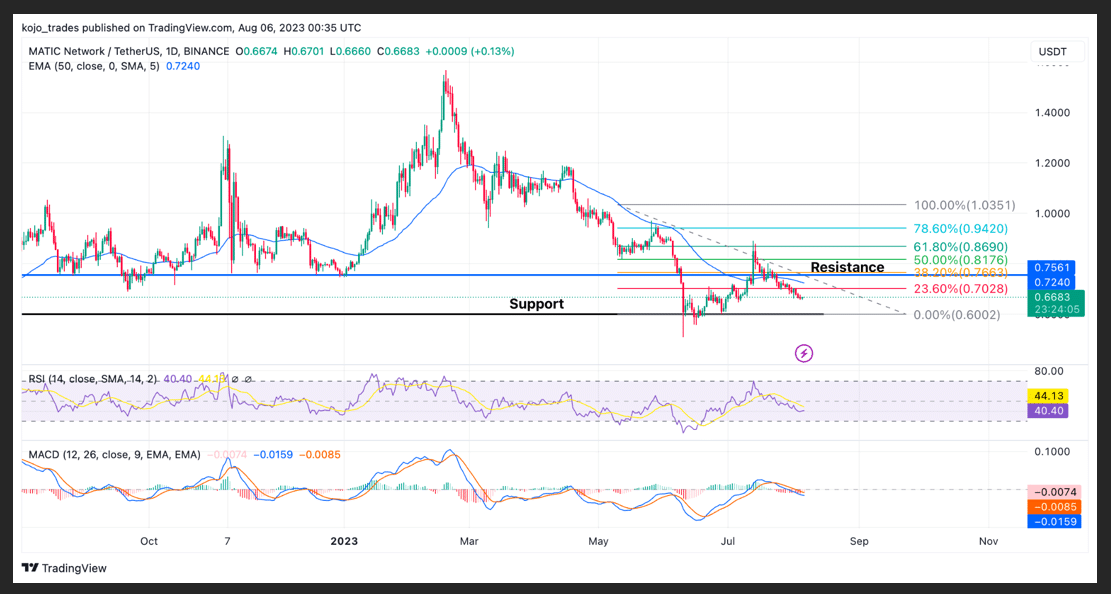
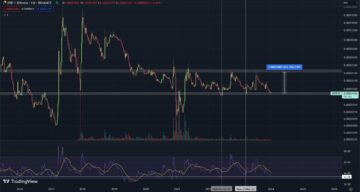
The price of MATIC/USDT has struggled to replicate its rally to a high of $1.5 despite huge backing from investors and many partnerships.
Polygon Matic remains one of the top 5 altcoins with real use cases as many traders and investors look for opportunities to invest in this token.
The price of MATIC/USDT suffered a price rejection from $1.5 as the price is dominated by bearish price action trading below the 50-day EMA as the price of MATIC failed to hold above $1.
The price of MATIC/USDT could retest $0.6 as bears look determined to push the price down to this key demand zone as buyers could be looking to open a long position for MATIC.
MATIC’s price needs to reclaim $1, corresponding to the 78.6% FIB value on the daily timeframe for MATIC. A break and close above $1 could give bulls more opportunity to increase the price to $1.5.
The MACD and RSI on the daily timeframe for MATIC indicate a bearish price trend as bears continue to show much strength over bulls.
Major daily resistance for MATIC – $0.88-$1
Major daily support for MATIC – $0.6
MACD – Bearish trend
GALA Daily Price Analysis Chart
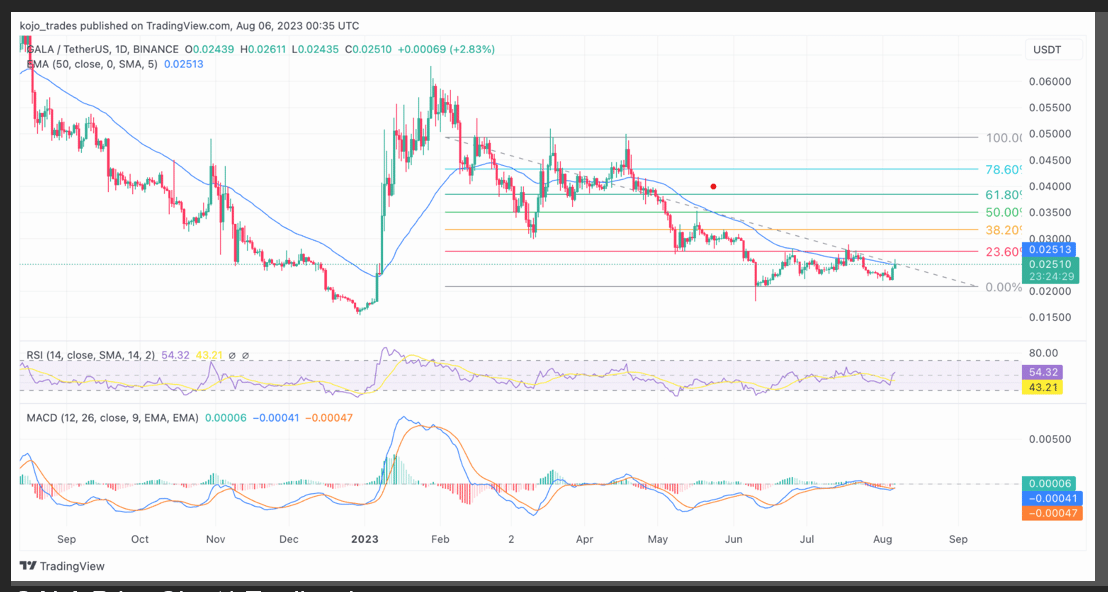
GALA has emerged as a top 5 altcoin to pay attention to with the rise of game tokens performing well in the last few days, with the likes of Yield Guild Games (YGG) rallying with over 70% gain in less than a few hours.
The price of GALA has performed well in previous months as the price rallied to a high of $0.06 before suffering a sharp price decline by bears to a low of $0.02, where the price formed a good support for the price.
GALA’s price has since traded below its 50-day EMA highlighting much bearish effect in its trend as the price has been unable to show a bullish price reaction until recently.
Despite its bearish price, GALA could be set to flip its trend to bullish as the price builds bullish price actions. The price of GALA needs to break and close above the FIB values of 23.6% and 38.2%, corresponding to $0.027 and $0.03, respectively.
A close above this region means a strong bullish price rally to a high of $0.045 and a high of $0.066.
MACD and RSI indicators show a bullish price change from bearish to bullish as bulls continue to dominate the price of GALA.
Major daily resistance for GALA – $0.027-$0.03
Major daily support for GALA – $0.02
MACD – Bullish trend
Follow Us on Twitter and Facebook.
Disclaimer: This content is informational and should not be considered financial advice. The views expressed in this article may include the author’s personal opinions and do not reflect The Crypto Basic’s opinion. Readers are encouraged to do thorough research before making any investment decisions. The Crypto Basic is not responsible for any financial losses.
-Advertisement-
- SEO Powered Content & PR Distribution. Get Amplified Today.
- PlatoData.Network Vertical Generative Ai. Empower Yourself. Access Here.
- PlatoAiStream. Web3 Intelligence. Knowledge Amplified. Access Here.
- PlatoESG. Automotive / EVs, Carbon, CleanTech, Energy, Environment, Solar, Waste Management. Access Here.
- BlockOffsets. Modernizing Environmental Offset Ownership. Access Here.
- Source: https://thecryptobasic.com/2023/08/06/weekly-top-5-altcoins-to-watch-gala-shib-matic-inj-ada/?utm_source=rss&utm_medium=rss&utm_campaign=weekly-top-5-altcoins-to-watch-gala-shib-matic-inj-ada
- :has
- :is
- :not
- :where
- 000
- 11
- 2%
- 2023
- 23
- 25
- 50
- 500
- 66
- 700
- 9
- a
- above
- acting
- Action
- actions
- ADA
- ADvantage
- Advertisement
- advice
- affect
- After
- ahead
- All
- Altcoin
- Altcoins
- an
- analysis
- Analysts
- and
- any
- ARE
- AREA
- areas
- article
- AS
- Assets
- At
- attention
- author
- average
- backing
- basic
- BE
- bearish
- bearish divergence
- Bears
- been
- before
- below
- BEST
- Better
- Big
- binance
- Binance Coin
- Binance Coin (BNB)
- Bitcoin
- bnb
- Break
- Breaking
- breakout
- breaks
- Broke
- BTC
- BTC Dominance
- btc price
- build
- builds
- bull
- Bull Run
- Bullish
- Bulls
- but
- buy
- buyers
- by
- Cardano
- cases
- Catalyst
- change
- Chart
- Close
- Closes
- closing
- Coin
- Concerns
- considered
- considering
- content
- continue
- continues
- control
- Convergence
- Corresponding
- corresponds
- could
- crypto
- crypto-assets
- cryptocurrencies
- Currently
- daily
- data
- Days
- decisions
- Decline
- Demand
- Despite
- determined
- direction
- Divergence
- do
- Dominance
- dominate
- down
- dramatically
- driving
- Drop
- dropped
- Dropping
- due
- effect
- EMA
- emerged
- emergence
- encouraged
- ETH
- Ether (ETH)
- ethereum
- ethereum (ETH)
- expectation
- experts
- exponential
- exponential moving average
- expressed
- Eyes
- faced
- faces
- Failed
- fails
- favor
- few
- Fibonacci
- financial
- financial advice
- Flip
- For
- formed
- from
- full
- Gain
- Gala
- GALA price
- game
- Games
- Give
- good
- guild
- Halving
- Have
- Heading
- healthy
- Hidden
- High
- higher
- highlighting
- Highs
- hold
- horizon
- HOURS
- http
- HTTPS
- huge
- if
- Ignite
- impending
- in
- include
- inclusion
- Increase
- increasing
- index
- indicate
- indicates
- indicating
- Indicators
- influence
- Informational
- initial
- INJ
- Injective
- Injective Protocol
- interest
- into
- Inu
- Invest
- investment
- Investors
- IT
- ITS
- just
- Key
- Key Areas
- Last
- lawsuit
- less
- let
- like
- likely
- likes
- likewise
- Litecoin
- Litecoin (LTC)
- Long
- Look
- looking
- LOOKS
- losses
- Low
- lower
- LTC
- MACD
- maintain
- major
- Making
- many
- mark
- Matic
- MATIC price
- max-width
- May..
- means
- Momentum
- months
- more
- moving
- moving average
- much
- needs
- New
- news
- no
- of
- off
- on
- ONE
- open
- Opinion
- Opinions
- opportunities
- Opportunity
- orders
- Other
- out
- over
- partnerships
- past
- Pay
- perform
- performance
- performed
- performing
- personal
- plato
- Plato Data Intelligence
- PlatoData
- player
- Point
- position
- positions
- previous
- price
- PRICE ACTION
- Price Analysis
- price chart
- price rally
- Prices
- protocol
- protocols
- Push
- rally
- reaction
- readers
- real
- recent
- recently
- reflect
- regain
- region
- regions
- relative
- relative strength index
- Relative Strength Index (RSI)
- remain
- remained
- remains
- research
- Resistance
- responsible
- retracement
- Ripple
- Ripple (XRP)
- Rise
- rsi
- Run
- s
- saw
- scenario
- see
- serving
- set
- several
- sharp
- SHIB
- should
- show
- shown
- Signs
- since
- Still
- strength
- strong
- Struggle
- Struggles
- success
- suffered
- suffering
- Suggests
- support
- Take
- tank
- test
- than
- The
- The Crypto Basic
- their
- There.
- These
- this
- timeframe
- to
- token
- Tokens
- top
- top 5
- tough
- towards
- trade
- traded
- Traders
- trades
- Trading
- Trend
- unable
- uncertainties
- under
- until
- us
- USDT
- use
- value
- Values
- views
- W3
- Watch
- we
- webp
- week
- weekly
- WELL
- which
- with
- xrp
- yearly
- YGG
- Yield
- Yield Guild Games
- zephyrnet
- zones