Bitcoin’s (BTC) trial to break out of its range has proven abortive for bulls as its rally in the early part of last week was cut short by bears when the price of Bitcoin saw its price drop from a high of $26,400 back to its price range of $25,700.
The price of Bitcoin’s inability to reclaim the highs of $26,500, which has become a minor resistance, continues to worry many traders and investors as the price of Bitcoin has failed to drop below its support of $25,300, raising concerns for bulls.
The price action for Bitcoin and other top-ranking cryptocurrencies like Ethereum have maintained low volume and less price action following Bitcoin remaining in huge price dominance by bears for the past month.
On-chain data shows the cryptocurrency market remains in less activity following Bitcoin’s low volume in activities except for some exceptional weekly top 5 cryptocurrencies that could rampage in the coming weeks.
– Advertisement –
Bitcoin has remained much under the influence of BTC bears for over a month now as the price of Bitcoin has failed to break past the high of $26,500 after the price of Bitcoin fell from its high of $29,500 to a low of $25,800.
The price of BTC currently trades below $26,000, suggesting the price of Bitcoin needs to break above the resistance of $26,500 for BTC bulls to push the price high to a region of $27,300 for a minor relief bounce to be possible.
Bitcoin’s price trading below the 50-day and 200-day Exponential Moving Averages (50-day and 200-day EMAs) signifies the bear-dominating price as the price would most likely continue in its downtrend if BTC bulls fail to reclaim the high of $26,500.
If the price of Bitcoin fails to hold above the minor support of $25,300, we could see the price pushed by BTC bears to a low of $24,000 to $23,500, acting as a demand zone for BTC price as bulls would look to defend this region and push price higher for a possible price recovery.
Bitcoin’s stalling in price has also had much effect on the like of Ethereum (ETH) as ETH has remained on a downward price movement for the past month, suggesting price has remained much under the influence of ETH bears.
After suffering rejection from a high of $2,000, the price of Ethereum has struggled to show real flame to the upside as Ethereum bears have dominated the price of Ethereum to the downside, giving ETH little or no room for price bounce to the upside.
If the price of ETH continues in its spiral downtrend, we could see the price retesting the lows of $1,550 to $1,500 before seeing a major price bounce to the upside as the price of Ethereum looks heavier to the downside than to the upside.
Despite the price of Bitcoin and Ethereum suffering much price decline, the cryptocurrency market has seen some great crypto tokens showing many signs of a potential price rally in recent weeks, with CYBER, PERP, and others rallying by over 300% within a week.
This has highlighted the need to pay attention to these weekly top 5 cryptocurrencies (SOL, LTC, XRP, SHIB, DOGE) and areas of interest for many traders and investors before their major moves to an upside or downside, depending on their price actions.
Solana (SOL) Price Analysis as a Weekly Top 5 Cryptocurrency to Watch
Solana (SOL) has remained a key figure in the cryptocurrency industry despite facing many controversies in the present crypto bear market. The price has dropped below expectation for many traders and investors.
Despite its price drop, Solana (SOL) remains a top 5 cryptocurrency token many traders and investors always have in their portfolio for a long-run price gain. Let us dive deep into its price analysis and performance ahead of the coming bull market.
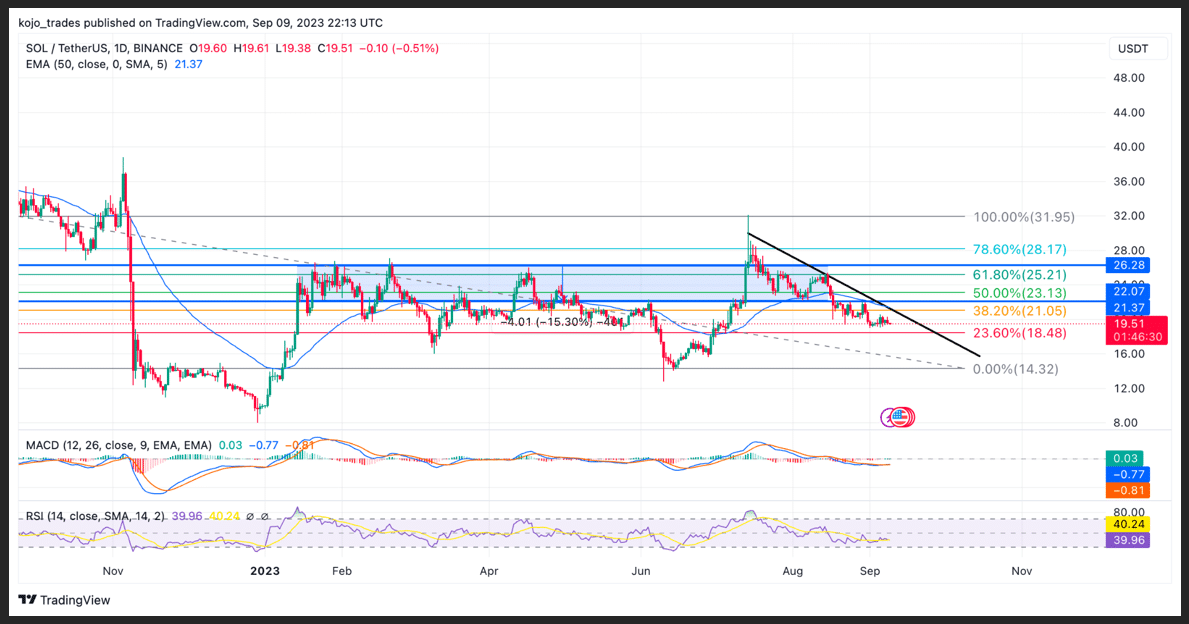
The price of SOL/USDT after finding strong support around a low of $14.5, the price of SOL/USDT bounced from this region as bulls pushed the price to a high of $31.5, acting as strong resistance for the price of SOL/USDT.
Solana’s price failed to break above this region of $31.5 as bears rejected the price to $26.2. The price of SOL/USDT has tried to reclaim the high of $31.5 as the price has failed to maintain a downward price trend as bears continue to push prices lower.
SOL/USDT has shown much strength in previous weeks, holding above $21 as the price faced a key decision to resist bears from pushing its price lower as the bulls failed to defend this key region for the price of SOL/USDT.
The price of SOL/USDT currently trades below $20 as the price looks weak in a bearish downtrend trading below the 50-day EMA, acting as resistance for the price of SOL/USDT from breaking above.
Solana’s bull needs to defend the price from breaking below the 23.6% Fibonacci Retracement value (23.6% FIB Value); else, we could see SOL’s bears pushing the price lower to a low of $14, possibly $12.
The Moving Average Convergence Divergence (MACD) for SOL/USDT on the daily timeframe shows bears maintaining their bearish price trend. Its Relative Strength Index (RSI) indicates low buy volume as bears stay in control.
If the price of SOL/USDT reclaims above $19, it would be good for bulls; a break below this region could signify a downtrend for SOL/USDT price.
Major SOL/USDT support zone – $19
Major SOL/USDT resistance zone – $23
MACD trend – Bearish
Litecoin (LTC) Price Analysis on the Daily (1D) Timeframe

The price of LItecoin (LTC) saw so much on-chain rise before its halving in August as the price of LTC/USDT rallied from its yearly low of $43 to a high of $115 as its price compensated for its halving hype acting as a huge catalyst for this top 5 cryptocurrency.
Leading to its halving, the price of LTC/USDT saw its price drop from its high of $115 to a low of $88 as many traders and investors suggested the price could rally to $165 as its minor price decline was to give opportunities to late buyers.
The price of LTC/USDT has continued to struggle to hold key regions of support after its halving as the price has continued its downtrend price movement that has seen the price trade lower than its support of $75.
The MACD and RSI for LTC/USDT on the daily timeframe suggest the price of LTC/USDT could bounce to a high of $70 if the crypto market produces a relief bounce.
LTC/USDT needs to hold above $65 to avoid retesting $50 support, acting as a good demand zone for the price of LTC/USDT. If the price of LTC/USDT is above $65, it could be a good sign for bulls.
Major LTC/USDT support zone – $65-$55
Major LTC/USDT resistance zone – $75
MACD trend – Bullish
Dogecoin (DOGE) Price Analysis as a Top 5 Cryptocurrency to Watch
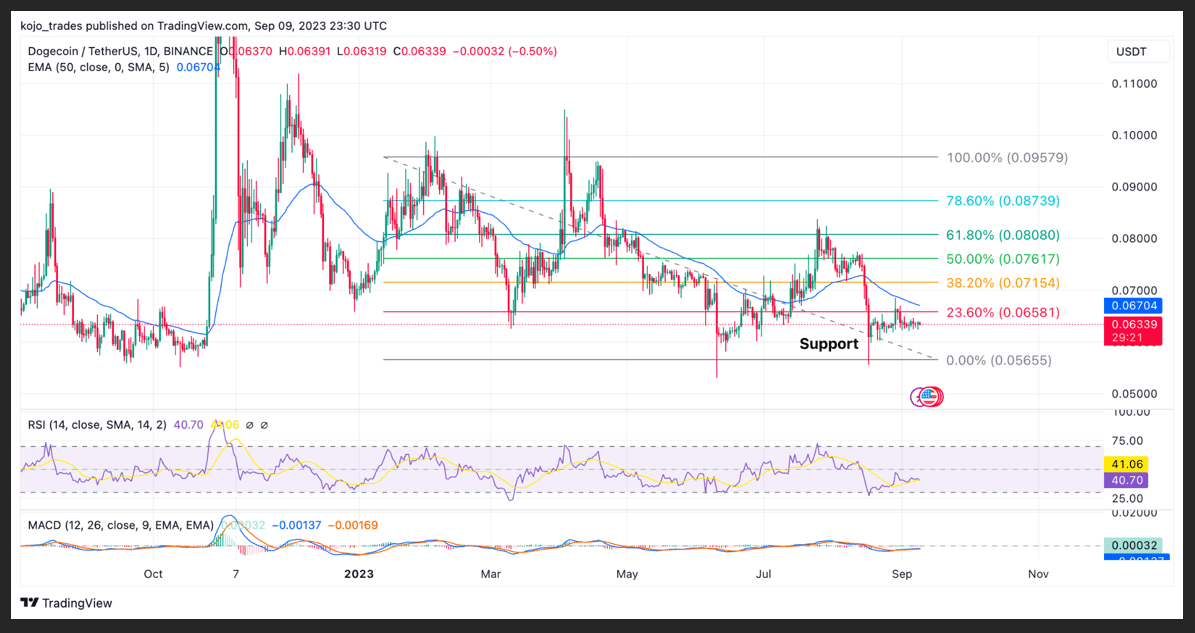
The price of Dogecoin (DOGE) has gone under the radar for the past few weeks despite many speculations of X (formerly Twitter) using this cryptocurrency as a mode of payment, as Elon remains a huge admirer of DOGE.
Dogecoin’s (DOGE) price has struggled to replicate the rally that has earned it this much fame and glory as the crypto market continues to be a huge challenge for the likes of DOGE/USDT as the price has remained in a downtrend for weeks.
The price of DOGE/USDT currently trades above the key area of interest of $0.055 for many traders and investors as the price of DOGE/USDT has respected this region on previous price decline down to this region.
If the price of DOGE/USDT loses this support of $0.055, we could have the price retest its yearly low of $0.045, which would seem extreme for the price to be that low for now.
The price of DOGE needs to reclaim above $0.075 before bulls would have much advantage to push the price higher as it continues to trade below its 50-day EMA, indicating many advantages for bears to push the price lower to $0.055.
Dogecoin MACD and RSI indicate bearish price dominance for the price of DOGE; bulls need to rescue the price of DOGE for these indicators to change from bearish to bullish as the price looks much more likely for $0.055.
Major DOGE/USDT support zone – $0.055
Major DOGE/USDT resistance zone – $0.067
MACD trend – Bearish
Ripple (XRP) Daily (1D) Timeframe Price Analysis
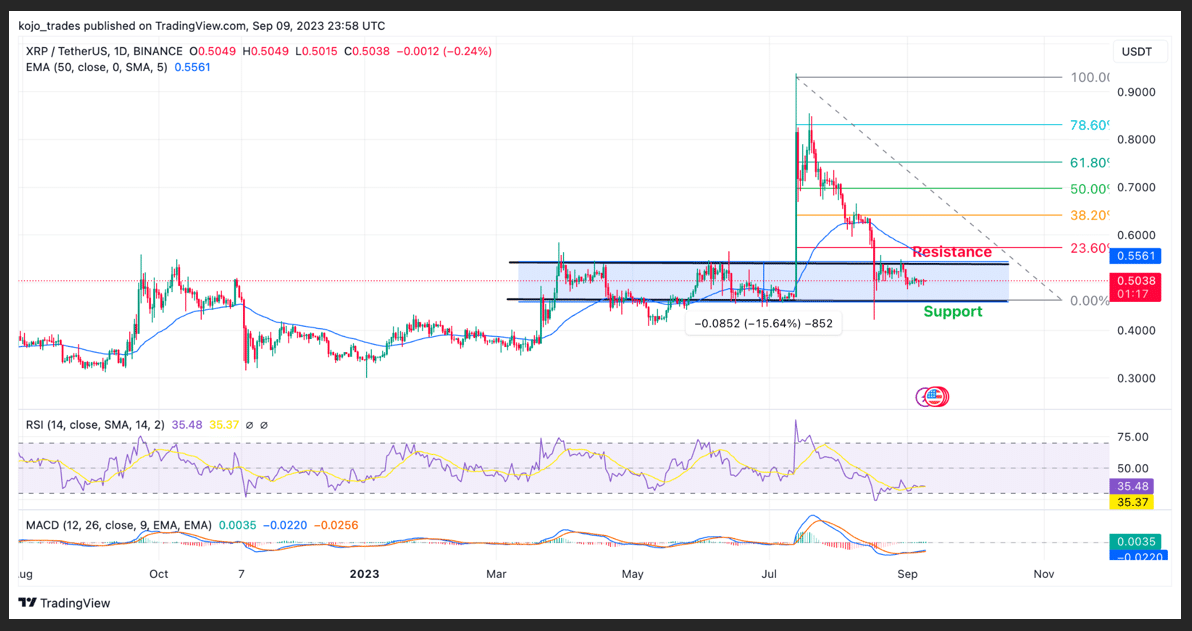
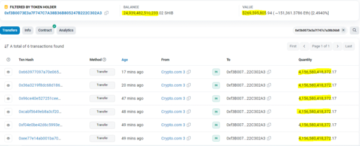
Ripple (XRP) continues to gain much popularity after its success in its US lawsuit as on-change data suggest many activities going on for this token, with a recent list on Kleverswap suggesting it’s just a matter of time before price compensates for such on-chain activities for XRP/USDT.
The price of XRP/USDT has remained in a downtrend after a few days of rallying to a high of $0.93 as many speculated the price of XRP/USDT to trend higher above $1 as the price failed to reach the expectations of many.
XRP/USDT has been in a range price movement for weeks now; a breakout from this range movement could see the price of XRP/USDT rally high or low in the direction of its breakout.
The price of XRP/USDT needs to hold above $0.45, acting as strong support for the price as the price has held well above this region. A breakout for XRP/USDT to the upside of $0.57 could see the price reclaim above $0.6, acting as resistance for the price as the price could aim to trend higher.
Ripple’s price trades below its daily 50-day EMA, suggesting a much bearish hold on price as its daily MACD and RSI indicate bears continue to show much dominance on the price of this token.
A breakout from its range movement for the price of XRP/USDT would be huge for either bulls or bears as the direction would determine XRP’s movement.
Major XRP/USDT support zone – $0.45
Major XRP/USDT resistance zone – $0.57
Shiba Inu (SHIB) Price Analysis as a Top 5 Crypto Asset
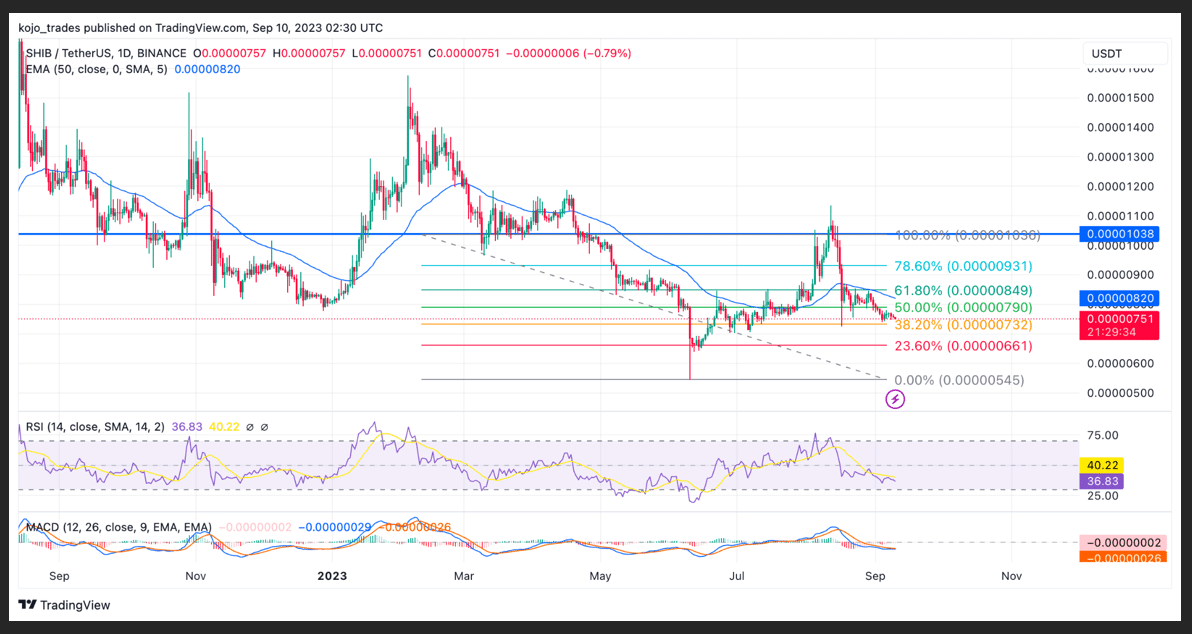
Despite its Shibarium hype, many tipped SHIB/USDT price to rally high considering how much hype Shibarium mainnet has generated, as many believe this could be a huge catalyst for SHIB price to a new yearly high.
The price of SHIB/USDT has remained less motivating with its price action as the price of SHIB/USDT rallied to a high of $0.00001100 before suffering a price decline to $0.00000750 as SHIB army attempts to hold off bears from pushing the price of SHIB lower.
The price of SHIB needs to hold above the 38.2% FIB value and reclaim its price above the 50-day EMA for the price to resume its bullish rally to a high of $0.00001200 or higher. If the price of SHIB fails to reclaim its price above $0.00000850, which corresponds to the 50-day EMA, we could see the price maintain a bearish downtrend.
SHIB’s price will retest the low of $0.00000660 if the price maintains a bearish price decline, as this region has proven to hold on several occasions against huge sell-offs.
Major SHIB/USDT support zone – $0.00000660
Major SHIB/USDT resistance zone – $0.00000850
MACD trend – Bearish
Follow Us on Twitter and Facebook.
Disclaimer: This content is informational and should not be considered financial advice. The views expressed in this article may include the author’s personal opinions and do not reflect The Crypto Basic’s opinion. Readers are encouraged to do thorough research before making any investment decisions. The Crypto Basic is not responsible for any financial losses.
-Advertisement-
- SEO Powered Content & PR Distribution. Get Amplified Today.
- PlatoData.Network Vertical Generative Ai. Empower Yourself. Access Here.
- PlatoAiStream. Web3 Intelligence. Knowledge Amplified. Access Here.
- PlatoESG. Automotive / EVs, Carbon, CleanTech, Energy, Environment, Solar, Waste Management. Access Here.
- PlatoHealth. Biotech and Clinical Trials Intelligence. Access Here.
- ChartPrime. Elevate your Trading Game with ChartPrime. Access Here.
- BlockOffsets. Modernizing Environmental Offset Ownership. Access Here.
- Source: https://thecryptobasic.com/2023/09/10/weekly-top-5-cryptocurrencies-to-watch-sol-ltc-xrp-shib-doge/?utm_source=rss&utm_medium=rss&utm_campaign=weekly-top-5-cryptocurrencies-to-watch-sol-ltc-xrp-shib-doge
- :has
- :is
- :not
- 000
- 11
- 2%
- 23
- 300
- 400
- 500
- 700
- a
- above
- acting
- Action
- actions
- activities
- activity
- ADvantage
- advantages
- Advertisement
- advice
- After
- against
- ahead
- aim
- also
- always
- an
- analysis
- and
- any
- ARE
- AREA
- areas
- Army
- around
- article
- AS
- Attempts
- attention
- AUGUST
- author
- average
- avoid
- back
- basic
- BE
- Bear
- Bear Market
- bearish
- Bears
- become
- been
- before
- believe
- below
- Bitcoin
- bitcoin and ethereum
- Bounce
- Break
- break out
- Breaking
- breakout
- BTC
- btc price
- bull
- Bull Market
- Bullish
- Bulls
- buy
- buyers
- by
- Catalyst
- challenge
- change
- Chart
- coming
- coming weeks
- compensated
- Concerns
- considered
- considering
- content
- continue
- continued
- continues
- control
- Convergence
- corresponds
- could
- crypto
- Crypto bear market
- Crypto Market
- CRYPTO TOKENS
- cryptocurrencies
- cryptocurrency
- Cryptocurrency Industry
- cryptocurrency market
- Currently
- Cut
- cyber
- daily
- data
- Days
- decision
- decisions
- Decline
- deep
- Demand
- Depending
- Despite
- Determine
- direction
- dive
- Divergence
- do
- Doge
- DOGE/USDT
- Dogecoin
- Dogecoin (DOGE)
- Dominance
- down
- downside
- downward
- Drop
- dropped
- Early
- earned
- effect
- either
- Elon
- else
- EMA
- encouraged
- ETH
- Ether (ETH)
- ethereum
- ethereum (ETH)
- Except
- exceptional
- expectation
- expectations
- exponential
- expressed
- extreme
- faced
- facing
- FAIL
- Failed
- fails
- FAME
- few
- Fibonacci
- Figure
- financial
- financial advice
- finding
- following
- For
- formerly
- from
- Gain
- generated
- Give
- Giving
- going
- gone
- good
- great
- had
- Halving
- Have
- Held
- High
- higher
- Highlighted
- Highs
- hold
- holding
- How
- http
- HTTPS
- huge
- Hype
- if
- in
- inability
- include
- index
- indicate
- indicates
- indicating
- Indicators
- industry
- influence
- Informational
- interest
- into
- Inu
- investment
- Investors
- IT
- ITS
- just
- Key
- Last
- Late
- lawsuit
- less
- let
- like
- likely
- likes
- List
- Litecoin
- Litecoin (LTC)
- little
- Look
- LOOKS
- Loses
- losses
- Low
- lower
- Lows
- LTC
- LTC/USDT
- MACD
- mainnet
- maintain
- maintaining
- maintains
- major
- Making
- many
- Market
- Matter
- max-width
- May..
- minor
- Mode
- Month
- more
- most
- movement
- moves
- moving
- moving average
- moving averages
- much
- Need
- needs
- New
- no
- now
- occasions
- of
- off
- on
- On-Chain
- Opinion
- Opinions
- opportunities
- or
- Other
- Others
- out
- over
- part
- past
- Pay
- payment
- performance
- personal
- plato
- Plato Data Intelligence
- PlatoData
- popularity
- portfolio
- possible
- possibly
- potential
- present
- previous
- price
- PRICE ACTION
- Price Analysis
- price chart
- price rally
- Prices
- produces
- proven
- Push
- pushed
- Pushing
- radar
- raising
- rally
- range
- reach
- readers
- real
- recent
- recovery
- reflect
- region
- regions
- relative
- relative strength index
- Relative Strength Index (RSI)
- relief
- remained
- remaining
- remains
- rescue
- research
- Resistance
- respected
- responsible
- resume
- retracement
- Rise
- Room
- rsi
- s
- saw
- see
- seeing
- seem
- seen
- several
- SHIB
- SHIB Price
- Shibarium
- Short
- should
- show
- showing
- shown
- Shows
- sign
- signifies
- signify
- Signs
- So
- SOL
- Solana
- Solana (SOL)
- some
- stalling
- stay
- strength
- strong
- Struggle
- success
- such
- suffering
- suggest
- support
- than
- that
- The
- The Crypto Basic
- their
- These
- this
- time
- timeframe
- to
- token
- Tokens
- top
- top 5
- trade
- Traders
- trades
- Trading
- Trend
- trial
- tried
- under
- Upside
- us
- USDT
- using
- value
- views
- volume
- W3
- was
- Watch
- we
- webp
- week
- weekly
- Weeks
- WELL
- when
- which
- will
- with
- within
- worry
- would
- X
- xrp
- XRP/USDT
- yearly
- zephyrnet