Introduction
When we talk about AI quality, what do we mean and understand? AI quality has been the backbone in terms of values for the organization. The quality of AI is what matters most and is one of the vital causes of the failure of any business or organization.
According to a survey or study, AI applications could generate an annual value of $3.5 to $5.8 trillion in 19 industries alone. The widespread availability of solutions for data preparation, model training, and model deployment has prompted a significant increase in adopting artificial intelligence (AI) and machine learning (ML) in businesses.
Now the main question that arises with the adaptation of AI in business gives birth to is, How can AI be used to create real, long-term value for an organization?
The answer to the question is Model Explainability. Now let us talk about Model Explainability. From the above paragraph, we can understand why we should focus on AI quality. So here, Model Explainability is the pillar backbone of AI.
Learning Objectives
- We will learn Lime, Drift, Fairness, and Model Explainability
- We will also learn how the single features affect the model by tools TruEra and WhatIfTools
This article was published as a part of the Data Science Blogathon.
Table of Contents
Model Explainability
Do we trust our model without knowing whether its decision is correct? How it made the decision based on what features?
If the model fails to observe the decision correctly, it will enable the failure in business as it will get affected based on the decision outcome. Apart from Model Explainability, fairness and Stability are the other backbones of AI quality. If we have to define the term Model Explainability, it is just how we view the model and its functions that help to give us the result or predict the outcome.
To answer a few questions, how do you explain your model? How do you conclude your model is best? Let us drive into details. Let us first talk about LIME. LIME is one of the models used in any machine learning model and enables us to understand the model.
LIME
Lime techniques make some changes in the input data sample. For these, it is necessary to input some changes in the input data sample and then check how it affects the level of prediction.
Mostly, the term used is a perturbation. In machine learning, adding random variations to the input data to test a model’s robustness and stability is termed perturbation. The purpose of perturbation is to identify areas of the input space where the model is likely to make incorrect predictions and how sensitive the model is to minute changes in the input.
LIME techniques modify or alter the single feature values and similarly observe the prediction, like We humans will want to know which features were unique to make the prediction.
Adding the noise to the input data and observing the model’s predictions change as the noise increases. We get to know if the model is overfitting to the training data and if it is making predictions based on features that aren’t relevant or misleading.
Let us take an example and understand what LIME does.
We uploaded a wine dataset in csv file to understand the working of LIME. First, install lime by using a pip.
pip install lime
import numpy as np
import pandas as pd
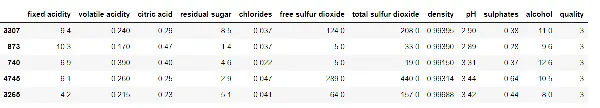
data = pd.read_csv('wine.csv', delimiter=';')
data.head()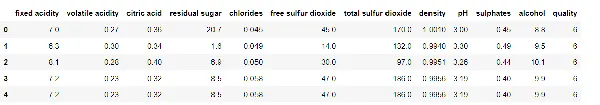
data.isna().sum()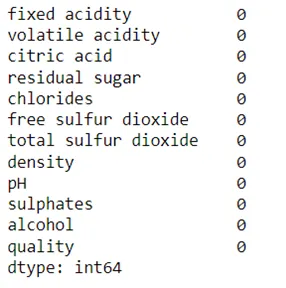
As we can see, the data has columns with no missing values, and quality is the target variable. We will move further to split the data into train and test.
from sklearn.model_selection import train_test_split
train = data.drop('quality', axis=1)
test = data['quality']
train, test, label_train, label_test = train_test_split( X, y, test_size=0.2, random_state=42
)
Now we will use the pycaret.
from pycaret.regression import *
s = setup(data, target = 'quality')
best = compare_models()
best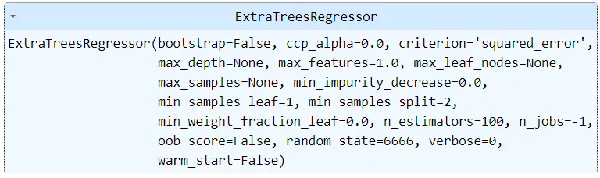
Now we will use ExtraTreesRegressor as a model. We will take the model score.
from sklearn.ensemble import ExtraTreesRegressor model = ExtraTreesRegressor(bootstrap=False, ccp_alpha=0.0, criterion='squared_error', max_depth=None, max_features=1.0, max_leaf_nodes=None, max_samples=None, min_impurity_decrease=0.0, min_samples_leaf=1, min_samples_split=2, min_weight_fraction_leaf=0.0, n_estimators=100, n_jobs=-1, oob_score=False, random_state=6666, verbose=0, warm_start=False) model.fit(train, label_train)
score = model_random.score(test, label_test)
score
0.58
Our model score shows 58% accuracy. Now we will use the lime that requires training data that should be in a numpy array. The second is a mode, which is classification in our case. The third class names that target variables, and the fourth are training data columns.
import lime
from lime import lime_tabular explain_lime = lime_tabular.LimeTabularExplainer( training_data=np.array(train), feature_names=train.columns, class_names=['bad', 'good','neutral'], mode='classification'
)
explain = explain_lime.explain_instance( data_row= test.iloc[1], predict_fn=model_extra.predict_proba
) explain.show_in_notebook(show_table=True)
print(test.iloc[1])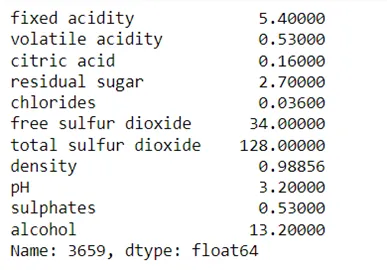
We will choose a random number to view the LIME results.
explain = explain_lime.explain_instance( data_row=test.iloc[20], predict_fn=model_extra.predict_proba
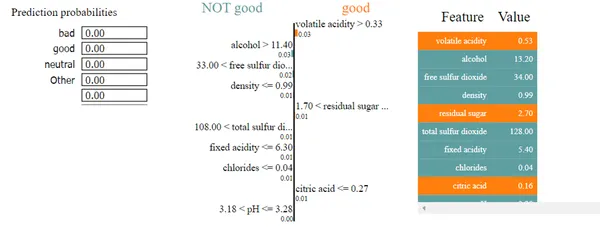
) explain.show_in_notebook(show_table=True)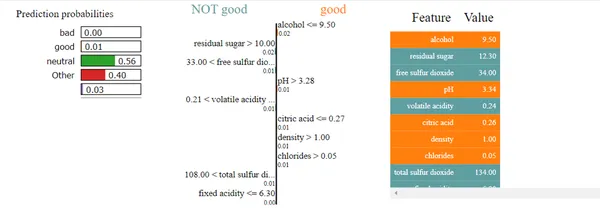
You can see the probability of good, bad, and neutral wine quality.
Good and not-good features let us know which feature or column values need to be less and what needs to be more for wine quality.
Fairness
What is fairness, and why should we be concerned about it? We know Machine learning has become part of our lives. Automated self-driving cars will become usual on the road after a gap of 5-10 years. Big companies like Amazon utilize it to sort and display the items according to your choices, followed by Netizens for pages, Linkedin for Job Candidates, and the US court uses the COMPAS algorithm for predictions of criminals.
Even if AI and Machine learning applications have grown, sometimes the data provided is unfair and one-sided. The COMPAS algorithm used by US court data shows a false positive rate more for crimes from Black than white people. There were other cases where Females outnumbered for jobs more than men. To make sure no one gets unfair treatment, AI must be unbiased.
Now the question arises why Bias happened in Machine learning? What is the reason? The answer is mainly due to data provided by human means of human error.
For example, sometimes, the training data is older. Suppose the job applicant gets chosen based on the manager’s decision of previous selection, and profiles of other candidates are more likely to get unnoticed or rejected even if their skills are high. Likewise, a limited amount of features can cause a problem, as the training data is less for that group. Unimportant or sensitive features can also be the root cause for biased.
So how will you define fairness in AI quality? It is the method that understands the unfairness in the model.
Fairness recognizes the biases in your data. It makes sure that your model makes accurate predictions for all groups. In Machine Learning, Fairness in the development phase can get utilized.
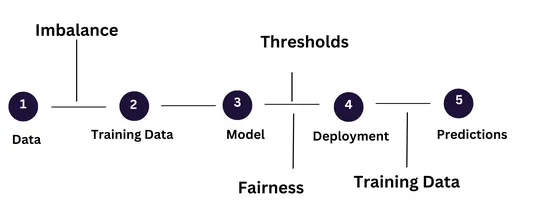
First, we will target the imbalanced dataset. What do we understand by the imbalance dataset? In machine learning, if the two groups have variations in the percentage, it will cause an imbalance. For example, in the email classification, the spam holders hold less percentage compared to the required emails that are imbalanced.
There are many methods to get balanced data, like undersampling, oversampling, and adding artificial data. Undersampling means taking out randomly the sample values from the higher class, making it balance the lower class. Oversampling means adding duplicate data to the lower class.
Adding artificial data, like in SMOTE, stands for Synthetic Over sampling minority techniques similar to oversampling by bootstrapping or K-nearest neighbors algorithm.
We will use TruEra, and WhatifTools to have an understanding of our data in a better way.
import pandas
import numpy
data =pd.read_csv('wine.csv', delimiter=';')
data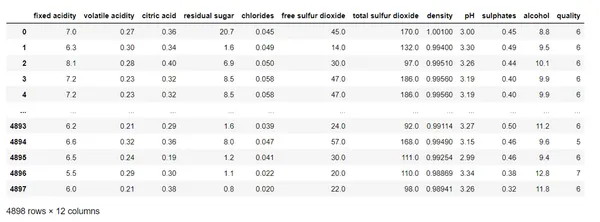
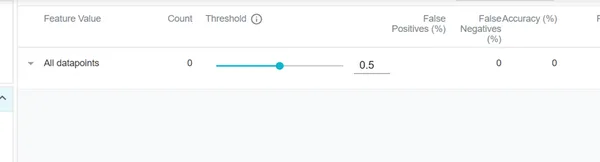
import witwidget from witwidget.notebook.visualization import WitWidget, WitConfigBuilder config_builder = (WitConfigBuilder(data.values.tolist(), data.columns.values.tolist())) WitWidget(config_builder, height=800)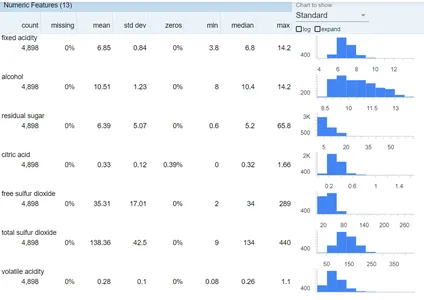
We have uploaded our data and can see a threshold of 0.5. A score of more than 0.5 means positivity which means high quality in the case of our data wine.
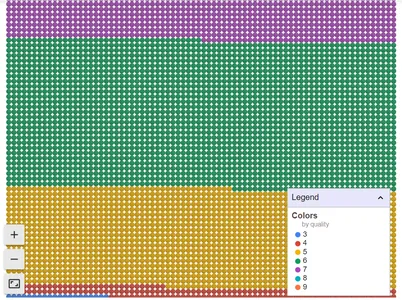
We will look at the visualization now as green color is more compared to other colors means data values of six in quality are more compared to other wine quality data.
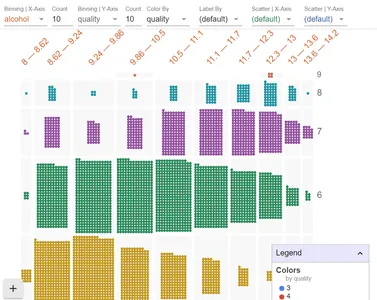
Let’s change the x-axis to the alcohol feature in our data and the y-axis to the quality.
data.sort_values(by=['quality'], ascending=True, inplace=True)
data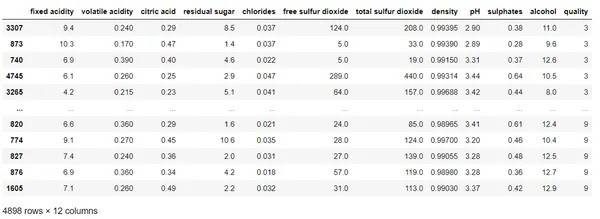
data = pd.get_dummies(data) data.head()
y = data['quality']
X = data.drop(columns=['quality']
train, test, label_train, label_test = train_test_split( X, y, test_size=0.2, random_state=42
)
from sklearn.metrics import mean_squared_error
print(f"RMSE = {mean_squared_error(test, model_extra.predict(label_test), squared=False)} ")
0.64
tru.add_data_collection("Wine")
tru.add_data_split( data_split_name="all", pre_data=X, label_data=y, split_type="all")
tru.add_data_split( data_split_name="train", pre_data=x_train, label_data=y_train, split_type="train")
tru.add_data_split( data_split_name="test", pre_data=x_test, label_data=y_test, split_type="test") tru.get_explainer(base_data_split="test").plot_isp(feature='free sulfur dioxide')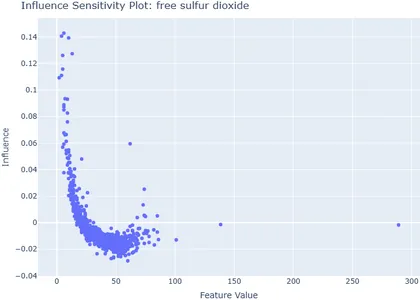
We just took the feature of free sulfur dioxide, and we can see the lower value of free sulfur dioxide influences the quality of the wine.
Drift
When the data changes over time, it is called a drift. The changes in the data can affect the model, as we know that the data relies on the key of the value of the past to predict the future.
For example, if we think of the concept of COVID-19 pre-pandemic and post-pandemic, we can see the sudden shift, which leads us to ask a few questions. One reason for the sudden shift? Second, whether my model is working well or needs some changes.
In another example, sudden changes in weather conditions and in-house sale prices can shift the data, making the model fails in predicting the future.
Similarly, if we see two images on our left and right side, whether it is a cat or not cat and the bike model in the previous older days can still be used now.

To answer this question, first, we should know how our model trained on the datasets. For example, if our model is trained on cat images and not on the big cat, it will just answer cat or no cat. Similarly, it will depend on the training data for bikes, whether it is trained, on features of having two wheels, etc. The real-world example can make the model fails in how it predicts.

Now, why does such a drift occurs? It can be due to a lack of data collection for some period, or sometimes a lack of data as in case of failure of credit card acceptance as compared to credit card acceptance chance or the data is quite old and not updated.
X is the input variable, f is the mapping function or the model, and then y as output is the prediction value.
y=f(X).
In a usual routine, the relation between input and output variables is static. But due to changes in the data over time, the function or model will fall if not updated according to the new change.
Some of the terms used in the drift as a covariate and data shift refer to the change of data over time and the relationship shared between input and output.
Now the question arises, how can we lessen the effect of drift? Well, the answer to this question is as simple. When we can understand the cause from its root, we can lower its acts on the model.
Sometimes the reason of the cause of the drift is the unbalanced feature that is not steady, and we can replace it with mean or median, or we can also remove it without replacing it.
One can identify the new features that are making the drift to occurs. Sometimes the changes that lead to the cause of a drift-like situation have no importance to add, and thus no changes are required.
SHAP
To explain the output model, SHAP (Shapely Additive Explanations) uses Shapely Values in practice.
It shows the measures of every feature, how they perform on the model, and whether it is positive or negative.
from sklearn.ensemble import ExtraTreesRegressor model = ExtraTreesRegressor(bootstrap=False, ccp_alpha=0.0, criterion='squared_error', max_depth=None, max_features=1.0, max_leaf_nodes=None, max_samples=None, min_impurity_decrease=0.0, min_samples_leaf=1, min_samples_split=2, min_weight_fraction_leaf=0.0, n_estimators=100, n_jobs=-1, oob_score=False, random_state=6666, verbose=0, warm_start=False)
model.fit(train, label_train)
!pip install shap
import shap explain = shap.TreeExplainer(model)
shap_values = explain.shap_values(X)
shap.initjs()
shap.force_plot(explain.expected_value, shap_values[0, :], X.iloc[0, :])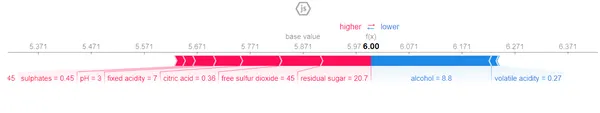
Now lets us interpret the visualization chart. The red marks show the features with higher prediction contribution and the blue with the lower value. Let’s see our wine data. We can see here that residual sugar, free sulfur oxide, and citric acid make the higher prediction, whereas alcohol and volatile acidity contribute to lower or worst quality.
To understand the effect of a single feature, we will plot another chart.
shap.dependence_plot('alcohol', shap_values, X)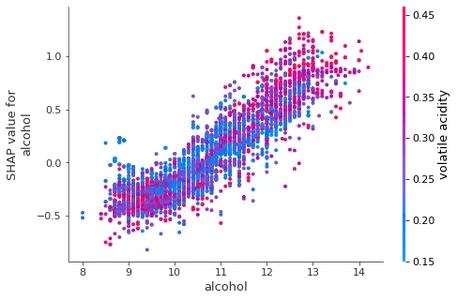
It shows changes in the wine quality as the change occurs in the value of alcohol.
We will plot a summary of all the features.
shap.summary_plot(shap_values, X)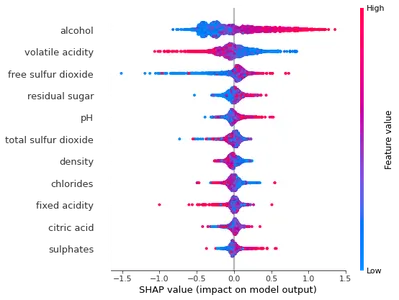
Here we can see that the low value of free sulfur dioxide and the high value of alcohol makes good wine quality.
Conclusions
The quality of AI Techniques plays a vital role in making any business progress. We here will point out how the drift and individual features affect the model.
The key takeaways of the article are as follows:
- We explained the importance of various AI Techniques in Machine learning, Model Explainability, fairness, and stability.
- We also explained the importance of AI Techniques such as Drift and Shapley’s values in shaping the model.
- We tried to explain Why the Drift occurs by taking an example of the wine dataset.
- We used TruEra, WhatifTools, and Shapley Values to explain our Wine data by showing which features make it’s quality higher and lower.
The media shown in this article is not owned by Analytics Vidhya and is used at the Author’s discretion.
Related
- SEO Powered Content & PR Distribution. Get Amplified Today.
- Platoblockchain. Web3 Metaverse Intelligence. Knowledge Amplified. Access Here.
- Source: https://www.analyticsvidhya.com/blog/2023/03/what-are-explainability-ai-techniques-why-do-we-need-it/
- :is
- $3
- 1
- 8
- a
- About
- about IT
- above
- acceptance
- According
- accuracy
- accurate
- acts
- adaptation
- Adopting
- affect
- After
- AI
- AI in Business
- Alcohol
- algorithm
- All
- alone
- Amazon
- amount
- analytics
- Analytics Vidhya
- and
- annual
- Another
- answer
- apart
- applications
- ARE
- areas
- Array
- article
- artificial
- artificial intelligence
- Artificial intelligence (AI)
- AS
- At
- Automated
- availability
- Backbone
- Bad
- Balance
- based
- BE
- become
- BEST
- Better
- between
- bias
- Big
- birth
- Black
- blogathon
- Blue
- business
- businesses
- by
- called
- CAN
- Can Get
- candidates
- card
- cars
- case
- cases
- CAT
- Cause
- causes
- Chance
- change
- Changes
- Chart
- check
- choices
- Choose
- chosen
- class
- classification
- collection
- color
- Column
- Columns
- Companies
- compared
- concept
- concerned
- conclude
- conditions
- contribute
- contribution
- correctly
- could
- Court
- COVID-19
- create
- credit
- credit card
- Crimes
- Criminals
- data
- Data Preparation
- datasets
- Days
- decision
- deployment
- details
- Development
- discretion
- Display
- drive
- effect
- emails
- enable
- enables
- error
- etc
- Ether (ETH)
- Even
- Every
- example
- Explain
- Explainability
- explained
- fails
- Failure
- fairness
- Fall
- Feature
- Features
- females
- few
- File
- First
- Focus
- followed
- follows
- For
- Fourth
- Free
- from
- function
- functions
- further
- future
- gap
- generate
- get
- Give
- gives
- good
- Green
- Group
- Group’s
- grown
- happened
- Have
- having
- help
- here
- High
- higher
- hold
- holders
- How
- HTTPS
- human
- Humans
- identify
- images
- imbalance
- import
- importance
- in
- Increase
- Increases
- individual
- industries
- input
- install
- Intelligence
- Introduction
- IT
- items
- ITS
- Job
- Jobs
- Key
- Know
- Knowing
- Lack
- lead
- Leads
- LEARN
- learning
- Lets
- Level
- like
- likely
- Lime
- Limited
- Lives
- long-term
- Look
- Low
- machine
- machine learning
- made
- Main
- make
- MAKES
- Making
- many
- mapping
- Matters
- means
- measures
- Media
- Men
- method
- methods
- Metrics
- minority
- minute
- missing
- ML
- Mode
- model
- models
- modify
- more
- most
- move
- names
- nav
- necessary
- Need
- needs
- negative
- neighbors
- Neutral
- New
- New Features
- Noise
- notebook
- number
- numpy
- observe
- of
- Old
- on
- ONE
- organization
- Other
- Outcome
- output
- owned
- pandas
- part
- past
- People
- percentage
- perform
- period
- phase
- Pillar
- plato
- Plato Data Intelligence
- PlatoData
- Point
- positive
- Positivity
- post-pandemic
- practice
- predict
- predicting
- prediction
- Predictions
- Predicts
- previous
- Prices
- probability
- Problem
- Profiles
- Progress
- provided
- published
- purpose
- quality
- quality data
- question
- Questions
- random
- Rate
- real
- real world
- reason
- recognizes
- Red
- regression
- relation
- relationship
- relevant
- remove
- replace
- required
- requires
- result
- Results
- road
- robustness
- Role
- root
- s
- sale
- Science
- Second
- selection
- self-driving
- sensitive
- shaping
- shared
- shift
- should
- show
- shown
- Shows
- significant
- similar
- Similarly
- Simple
- single
- situation
- SIX
- skills
- So
- Solutions
- some
- Space
- spam
- split
- Stability
- stands
- steady
- Still
- Study
- such
- sudden
- SUMMARY
- Survey
- synthetic
- Take
- Takeaways
- taking
- Talk
- Target
- techniques
- terms
- test
- that
- The
- The Future
- their
- These
- Think
- Third
- threshold
- time
- to
- tools
- Train
- trained
- Training
- treatment
- Trillion
- TRU
- Trust
- understand
- understanding
- understands
- unique
- updated
- uploaded
- us
- use
- utilize
- utilized
- value
- Values
- variables
- various
- View
- visualization
- vital
- volatile
- Way..
- Weather
- WELL
- What
- What is
- whether
- which
- white
- widespread
- will
- WINE
- with
- without
- working
- Worst
- X
- years
- Your
- zephyrnet