Published 2 hours ago
A parallel channel pattern of the daily time frame chart directs the ongoing recovery in the XMR/USDT pair. With the coin price currently trading at the $162.7 mark, the bull run has registered a 73.56% from the $96.8 support. However, with the momentum indicator(RSI) projecting negative divergence, the altcoin seems under bearish threat.
advertisement
Key points:
- The rising 20 and 50-day EMA reflects a short-term bullish trend.
- A higher price rejection candle at $165 indicates intense supply pressure
- The intraday trading volume in Monero coin is $147 Million, indicating a 63% hike.
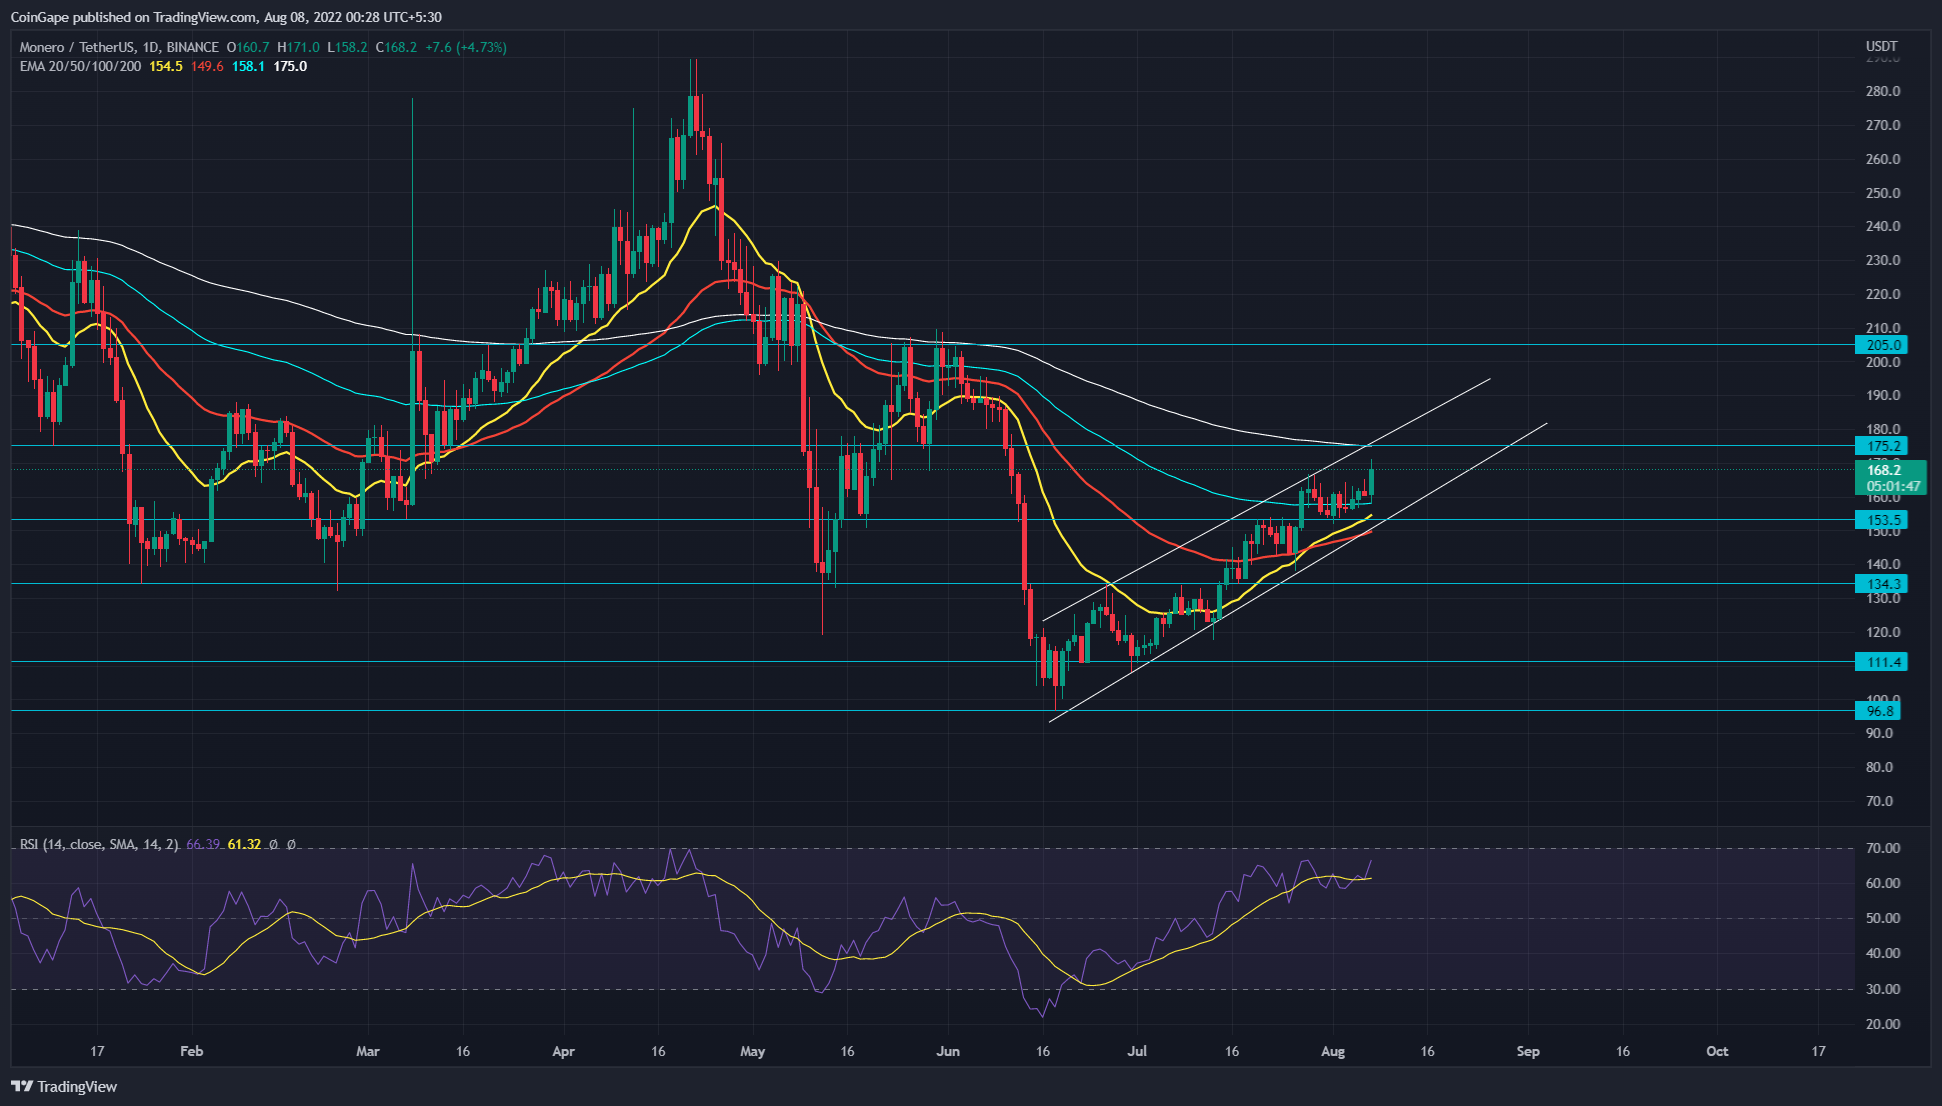
Source- Tradingview
Over the past two months, the XMR price has knocked out multiple resistances and flipped them into viable footing to accelerate the bullish momentum. Furthermore, on August 1st, the coin price rebounded from the recently breached $153.4 resistance and surged 6.5% in just a week.
If the buying pressure persists, the XMR may rise another 8% before hitting the combined resistance of the ascending trendline and $175.2.
Trending Stories
However, in theory, this channel pattern encourages a significant correction once the coin breaks the support trendline. Thus, in response to this pattern, the XMR price has a better possibility of reverting from the $175.2 resistance.
A breakdown below the support trendline may trigger a significant retracement which could plunge the XMR price to $134.5 mark. However, the bearish thesis will be invalidated if the bullish momentum is sustained and breakout the resistance trendline.
Technical analysis
RSI indicator: The daily RSI slope moving sideways concerning the rising price action indicates losing bullish momentum. Such Bearish divergence near the overbought territory accentuates the upcoming price correction.
advertisement
EMAs: the 200-day EMA slope near the $175 resistance puts an additional barrier against buyers. On the flip side, the 20-and-100-day EMA nearing a bullish crossover may bring more buying orders to the market.
- Resistance levels- $175 and $200
- Support levels- $152 and $133.7
Share this article on:
The presented content may include the personal opinion of the author and is subject to market condition. Do your market research before investing in cryptocurrencies. The author or the publication does not hold any responsibility for your personal financial loss.
- Bitcoin
- blockchain
- blockchain compliance
- blockchain conference
- coinbase
- Coingape
- coingenius
- Consensus
- crypto conference
- crypto mining
- cryptocurrency
- decentralized
- DeFi
- Digital Assets
- ethereum
- machine learning
- Monero (XMR)
- monero price analysis
- non fungible token
- plato
- plato ai
- Plato Data Intelligence
- Platoblockchain
- PlatoData
- platogaming
- Polygon
- Price Analysis
- proof of stake
- W3
- zephyrnet