- XRP price started a fresh decline from the $0.5550 resistance against the US dollar.
- The price is now trading below $0.540 and the 55 simple moving average (4 hours).
- There is a key bearish trend forming with resistance near $0.5300 on the 4-hour chart of the XRP/USD pair (data source from Bittrex).
- The pair could extend losses if it breaks the $0.510 support zone.
XRP price is struggling below $0.555 against the US Dollar, unlike Bitcoin. The price could decline further if it settles below the $0.510 support in the near term.
XRP Price Analysis
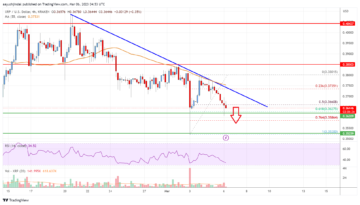
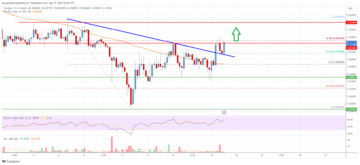
In the past few sessions, Ripple’s XRP price started a fresh decline from the $0.5550 zone against the US Dollar. The XRP/USD pair stayed below the $0.535 level and extended its decline.
The bears were able to push the price below the $0.5120 support. A low was formed near $0.4961, and the price is now consolidating losses. There was a minor increase above the $0.5120 level. The price climbed above the 50% Fib retracement level of the downward move from the $0.5548 swing high to the $0.4961 low.
XRP is now trading below $0.535 and the 55 simple moving average (4 hours). Immediate resistance on the upside is near the $0.5300 level. There is also a key bearish trend forming with resistance near the $0.5300 on the 4-hour chart of the XRP/USD pair.
It is near the 61.8% Fib retracement level of the downward move from the $0.5548 swing high to the $0.4961 low. The next major resistance is near the $0.5410 level.
A clear move above $0.5410 might start a fresh increase. In the stated case, the price could even surpass the $0.5550 resistance. Any more gains might send the price toward the $0.600 resistance.
Initial support on the downside is near $0.510. The next major support is near the $0.4960 level. The main support sits at $0.4850. Any more losses could lead the price toward the $0.450 level, below which the price might even test $0.425.

Looking at the chart, XRP price is now trading below the $0.545 zone and the 55 simple moving average (4 hours). Overall, the price could extend losses if it breaks the $0.510 support zone.
Technical indicators
4 hours MACD – The MACD for XRP/USD is now gaining momentum in the bearish zone.
4 hours RSI (Relative Strength Index) – The RSI for XRP/USD is below the 50 level.
Key Support Levels – $0.510, $0.500, and $0.496.
Key Resistance Levels – $0.530 and $0.555.
- SEO Powered Content & PR Distribution. Get Amplified Today.
- PlatoData.Network Vertical Generative Ai. Empower Yourself. Access Here.
- PlatoAiStream. Web3 Intelligence. Knowledge Amplified. Access Here.
- PlatoESG. Carbon, CleanTech, Energy, Environment, Solar, Waste Management. Access Here.
- PlatoHealth. Biotech and Clinical Trials Intelligence. Access Here.
- Source: https://www.livebitcoinnews.com/xrp-price-analysis-bulls-struggle-to-clear-key-hurdles/
- :is
- 425
- 50
- 500
- a
- Able
- above
- against
- also
- analysis
- and
- any
- At
- average
- bearish
- Bears
- below
- Bitcoin
- Bitcoin News
- bittrex
- breaks
- Bulls
- case
- Chart
- clear
- Climbed
- consolidating
- could
- data
- Decline
- Dollar
- downside
- downward
- Even
- extend
- extended
- few
- For
- formed
- fresh
- fresh increase
- from
- further
- gaining
- Gains
- High
- HOURS
- HTTPS
- Hurdles
- if
- immediate
- in
- Increase
- index
- IT
- ITS
- Key
- lead
- Level
- levels
- live
- Live Bitcoin News
- losses
- Low
- MACD
- Main
- major
- max-width
- might
- minor
- Momentum
- more
- move
- moving
- moving average
- Near
- news
- next
- now
- of
- on
- overall
- pair
- past
- plato
- Plato Data Intelligence
- PlatoData
- price
- Price Analysis
- Push
- relative
- relative strength index
- Resistance
- retracement
- rsi
- send
- sessions
- settles
- Simple
- sits
- Source
- start
- started
- stated
- stayed
- strength
- Struggle
- Struggling
- support
- support levels
- surpass
- Swing
- term
- test
- The
- There.
- to
- toward
- Trading
- TradingView
- Trend
- unlike
- Upside
- us
- US Dollar
- was
- were
- which
- with
- xrp
- XRP Price
- XRP price analysis
- XRP/USD
- zephyrnet
- zone