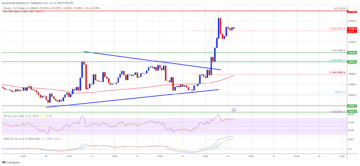
Ripple is consolidating above the $0.500 support against the US Dollar. XRP price could rally if there is a clear move above the $0.535 resistance.
- Ripple started a fresh increase from the $0.500 zone against the US dollar.
- The price is now trading above $0.510 and the 100 simple moving average (4 hours).
- There is a major bullish trend line forming with support near $0.5100 on the 4-hours chart of the XRP/USD pair (data source from Kraken).
- The pair might gain bullish momentum if it clears the $0.535 resistance zone.
Ripple Price Eyes Another Increase
After forming a base above the $0.4880 zone, Ripple’s XRP started a fresh increase against the US Dollar. There was a steady increase above the $0.500 and $0.510 resistance levels, similar to Bitcoin.
The price climbed above the $0.525 resistance but the bears seem to be protecting the $0.535 zone. The recent high is formed near $0.5382 and the price is now consolidating. It traded below the 23.6% Fib retracement level of the upward move from the $0.5072 swing low to the $0.5382 high.
XRP is now trading above $0.510 and the 100 simple moving average (4 hours). There is also a major bullish trend line forming with support near $0.5100 on the 4-hours chart of the XRP/USD pair.

Source: XRPUSD on TradingView.com
Initial resistance is near the $0.5320 zone. The first major resistance is near the $0.535 level. A successful break above the $0.535 resistance might send the price toward the $0.5475 resistance. Any more gains might send the price toward the $0.600 level.
Are Dips Supported in XRP?
If ripple fails to clear the $0.535 resistance zone, it could continue to move down. Initial support on the downside is near the $0.522 zone.
The next major support is near $0.519 or the 61.8% Fib retracement level of the upward move from the $0.5072 swing low to the $0.5382 high. The main support is near $0.510 or the trend line. If there is a downside break and a close below the $0.510 level, XRP’s price could extend losses. In the stated case, the price could test the $0.488 support zone.
Technical Indicators
4-Hours MACD – The MACD for XRP/USD is now gaining pace in the bullish zone.
4-Hours RSI (Relative Strength Index) – The RSI for XRP/USD is now above the 50 level.
Major Support Levels – $0.519, $0.510, and $0.488.
Major Resistance Levels – $0.535, $0.5475, and $0.600.
- SEO Powered Content & PR Distribution. Get Amplified Today.
- Platoblockchain. Web3 Metaverse Intelligence. Knowledge Amplified. Access Here.
- Source: https://www.newsbtc.com/analysis/xrp/xrp-price-prediction-ripple-0-06/
- :is
- 100
- a
- above
- against
- and
- Another
- any
- average
- base
- BE
- Bears
- below
- Break
- Bullish
- Bulls
- case
- Chart
- clear
- Climbed
- Close
- consolidating
- continue
- could
- data
- Dollar
- down
- downside
- extend
- Eyes
- fails
- First
- For
- formed
- fresh
- fresh increase
- from
- Gain
- gaining
- Gains
- High
- higher
- HOURS
- HTTPS
- in
- Increase
- index
- initial
- IT
- Kraken
- Level
- levels
- Line
- losses
- Low
- MACD
- Main
- major
- max-width
- might
- Momentum
- more
- move
- moving
- moving average
- Near
- NewsBTC
- next
- of
- on
- Pace
- plato
- Plato Data Intelligence
- PlatoData
- prediction
- price
- Price Prediction
- protecting
- rally
- recent
- relative strength index
- Resistance
- retracement
- Ripple
- rsi
- similar
- Simple
- Source
- started
- stated
- steady
- strength
- successful
- support
- support levels
- Supported
- Swing
- test
- The
- to
- toward
- traded
- Trading
- TradingView
- Trend
- upward
- us
- US Dollar
- with
- xrp
- XRP Price
- XRP price prediction
- XRP/USD
- zephyrnet