XRP Market Moves in Ranges – January 29
The Ripple XRP/USD market moves in ranges over a couple of trading days’ sessions at a lower spot. The crypto-economic price trades between $0.62 and $0.60 at a smaller positive percentage of 1.59 as of writing. It seems that pressure to the upside is relatively ongoing.
Market Moves in Ranges: XRP Market
Key Levels:
Resistance levels: $0.70, $0.80, $0.90
Support levels: $0.50, $0.40, $0.30
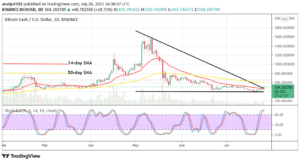
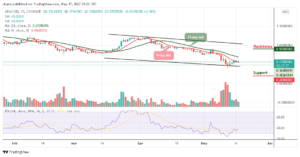
XRP/USD – Daily Chart
The Ripple XRP/USD daily chart showcases the crypto market operation moves in ranges around the $0.60 level. About a few days back, there has been a formation of lower lows closely above the lower bearish channel trend line drawn. The 14-day SMA indicator bends southward closer to the $0.70 resistance level underneath the 50-day SMA indicator. The Stochastic Oscillators are between 40 and 20 ranges with clogged lines slightly pointing northbound. That signifies that upward pressure is somewhat ongoing.
When will the Ripple XRP/USD market change its direction as it moves in ranges presently?
The Ripple XRP/USD trade may have to maintain its current trading outlook around $0.60 for some sessions as the crypto-economic market moves in ranges. It would be technically ideal that price is allowed to build its supports between the value line mentioned earlier and the $0.50 levels before long-position takers will have a chance to take a re-launch of buying order. A sudden aggressive reversal motion against the same point earlier mentioned may plunge the market into a downward trading trend continuation.
On the downside of the technical analysis, the Ripple XRP/USD market short-position takers may have to exercise some degrees of patience by allowing price to rally northward to find resistance around the $0.70 as indicated by the 14-day SMA before deciding to go for a shorting order of the crypto economy. If the market continues to range around $0.60, the exertion of trading positions will have to suspend for a while.
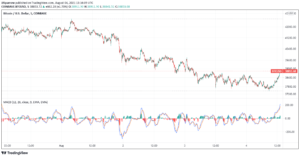
XRP/BTC Price Analysis
In comparison, Ripple XRP’s trending weight is lesser than with Bitcoin. The cryptocurrency pair market moves lower under the trend lines of the SMAs. The 50-day SMA indicator is above the 14-day SMA indicator. The Stochastic Oscillators are in the oversold region, slightly bending toward the southbound The base crypto is encountering a depression inflicted on it by the counter crypto. Being as it is, there has not been a reliable bullish signal to portend an end to the pace of downward forces between the two cryptos. However, it may as well not be too safe to follow the downward motion from its present trading spot to get lower positions to the downside.
Looking to buy or trade Bitcoin (BTC) now? Invest at eToro!
68% of retail investor accounts lose money when trading CFDs with this provider.
Read more:
Source: https://insidebitcoins.com/news/xrp-price-prediction-xrp-usd-market-moves-in-ranges
- "
- 70
- About
- Allowing
- analysis
- around
- bearish
- being
- Bitcoin
- BTC
- build
- Bullish
- buy
- buy bitcoin
- Buying
- change
- closer
- continues
- Couple
- crypto
- Crypto Market
- cryptocurrency
- Current
- depression
- economy
- Exercise
- follow
- HTTPS
- investor
- IT
- January
- Level
- Line
- Market
- money
- order
- Outlook
- percentage
- prediction
- present
- pressure
- price
- Price Prediction
- public
- rally
- range
- retail
- Ripple
- safe
- Shorting
- Spot
- Supports
- Technical
- Technical Analysis
- trade
- trades
- Trading
- trending
- value
- W3
- writing
- xrp
- XRP Price
- XRP/USD