One of the most important things we could get from looking at historical price data is the swing highs and the swing lows. This is because these are points wherein the price showed signs of price rejection. Therefore, the market might also be viewing these points as possible support and resistance zones. Several scenarios could happen as the price reaches these levels. Price could reverse, break out with very strong momentum, or break out of the level then pull back towards the zone before it bounces off again.
This trading strategy trades a momentum breakout and pullback setup wherein we wait for the price to break a support or resistance zone and then wait for the pullback to enter the trade. It uses only a couple of technical indicators which are the Zigzag indicator and the Patterns on Chart Indicator.
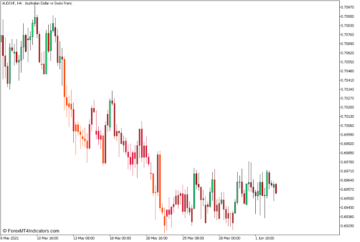
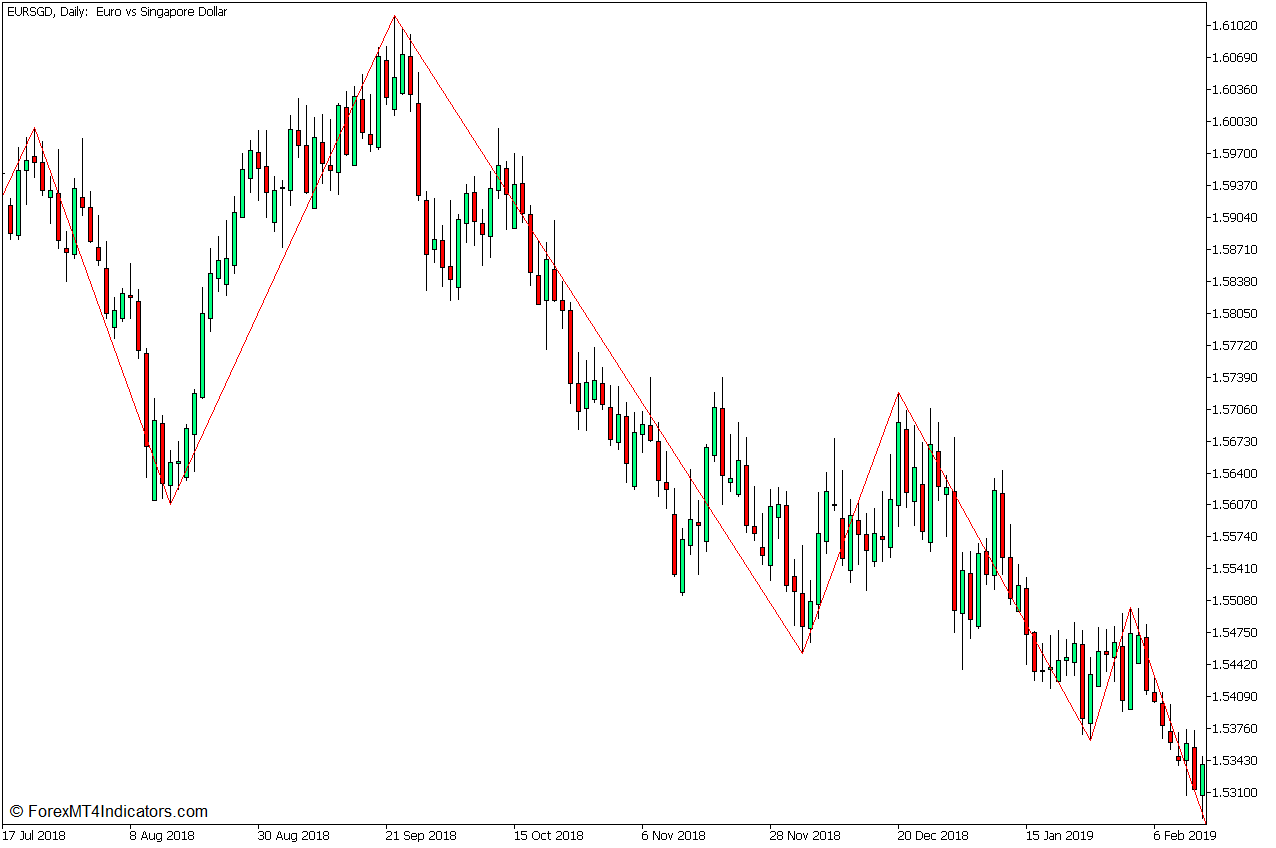
Zigzag Indicator
As mentioned earlier, swing highs and swing lows are important price levels because they can also be considered support and resistance zones. However, most new traders find it difficult to effectively identify swing highs and swing lows on a naked chart. This is because identifying these swing highs and swing lows requires skills that take a lot of screen time to develop. This is where the Zigzag indicator can help us.
The Zigzag indicator is a technical analysis tool that automatically identifies points on the price where the price is reversed more than a preset percentage variable against a prior momentum direction. These points can be identified as swing highs and swing lows or pivot highs and pivot lows. The Zigzag indicator then connects these points with a line making it much easier for traders to objectively identify swing highs and swing lows. It also creates a zigzag-like pattern thus it is called the Zigzag indicator.
The swing highs and swing lows identified by the Zigzag Indicator can be used as a basis for identifying support and resistance zones that price action can either reject and reverse from, break out from, or pull back on.

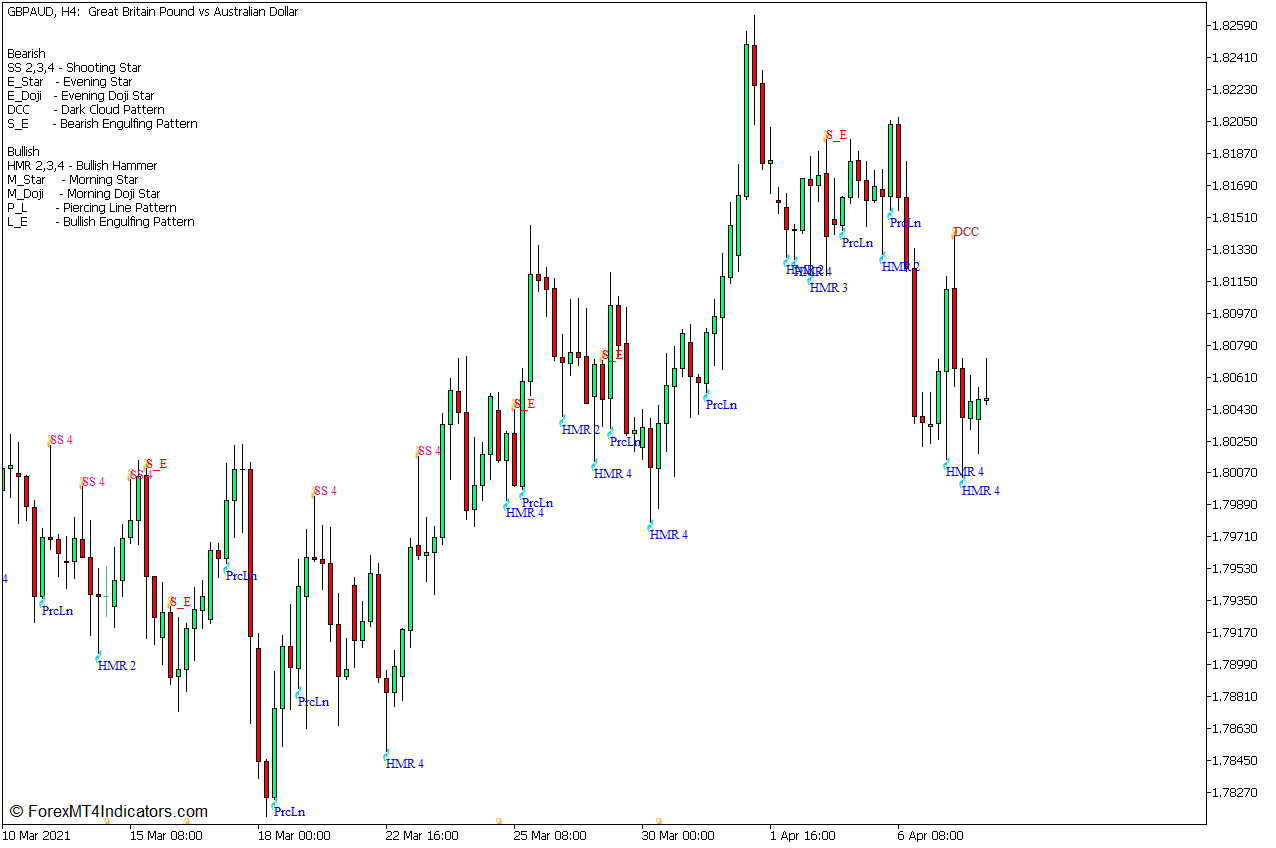
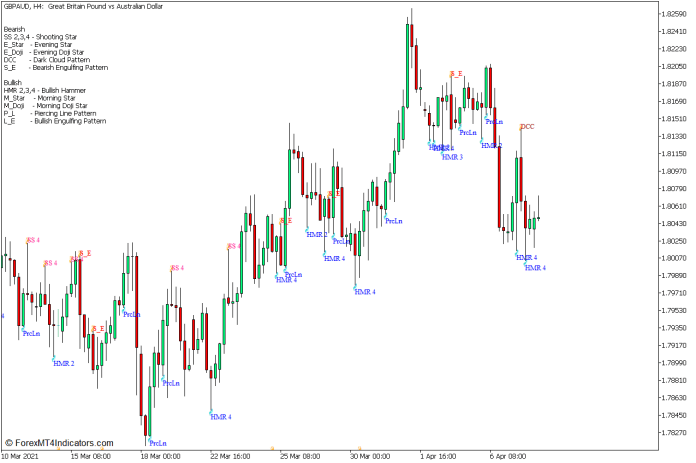
Patterns on Chart Indicator
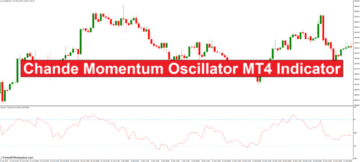
Candlestick patterns can be a very effective technical analysis signal that traders can use for identifying possible price reversals. This is because candlestick patterns tell us a story of how the market is reacting towards certain price levels. It could show us how the market is rejecting certain price levels causing price to form such candlestick patterns. Traders who are familiar with it can make timely decisions to capitalize on certain market moves before it start to move with strong momentum. Traders who are not accustomed to trading with candlestick patterns may find it difficult to objectively identify these patterns.
Patterns on Chart is a custom technical indicator that automatically identifies specific candlestick patterns. It labels the candlestick pattern with the short name of the pattern. It also displays the corresponding names of the different bullish and bearish patterns on the upper left corner of the chart for easier reference. This allows traders to objectively identify such patterns and make trade decisions based on the signals they see.
Trading Strategy Concept
This trading strategy is a momentum breakout continuation strategy that trades on the pullbacks which commonly develops right after a strong breakout price swing. This strategy uses the Zigzag Indicator and the Patterns on the Chart Indicator to simplify the process of identifying the pullback trade entries.
We will use the pivot lows and pivot highs identified by the Zigzag indicator as our basis for identifying our support zones and resistance zones. We will then wait for breakouts and pullbacks occurring on these zones for our trade setups.
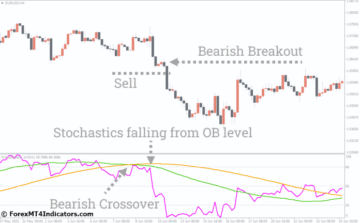
Candlestick pattern trade signals can be fairly reliable. However, not all trade signals would work as an actual reversal. These signals tend to be more effective when the patterns develop on major support or resistance levels. As such, we will use this indicator in conjunction with support or resistance zones we find using the Zigzag indicator. Reversal signals that develop on a support or resistance zone after a pullback is considered as a valid trade setup.
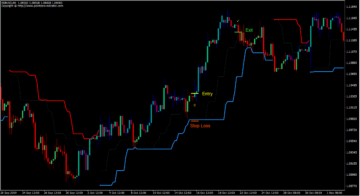
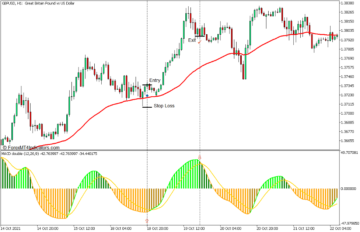
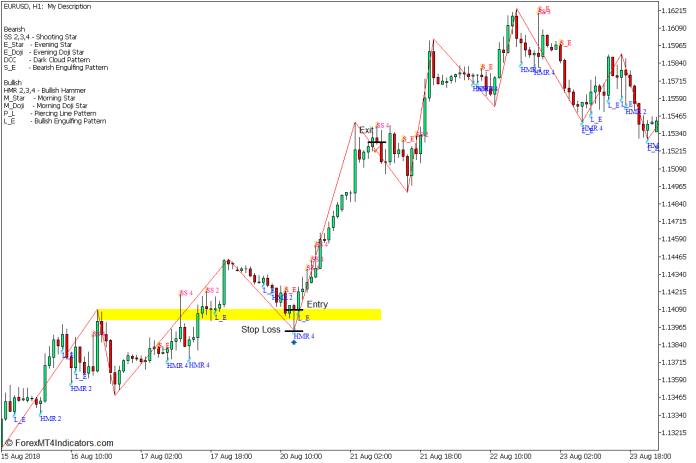
Buy Trade Setup
Entry
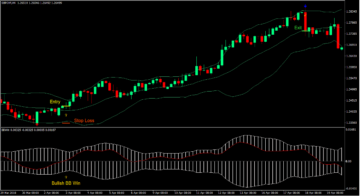
- Price action should break above a major resistance zone which is based on the swing high of the Zigzag indicator with strong momentum.
- Price should pull back towards the broken resistance zone which is now a support zone and show signs of price rejection.
- The Patterns on the Chart Indicator should identify a bullish reversal candle as the price touches the area of the zone.
- Enter a buy order on the confirmation of these conditions.
Stop Loss
- Set the stop loss on the support level below the bullish reversal pattern.
Exit
- Close the trade as soon as a bearish reversal pattern develops.

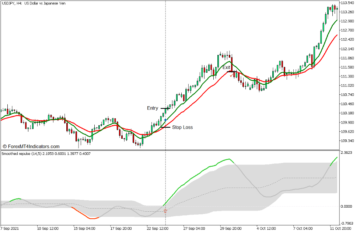
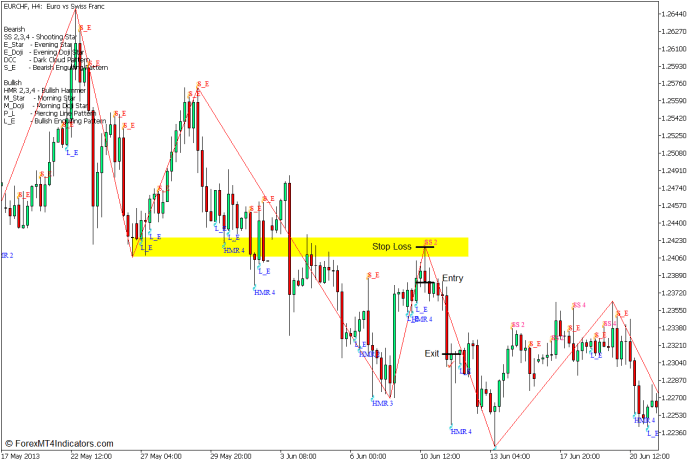
Sell Trade Setup
Entry
- Price action should drop below a major support zone which is based on the swing low of the Zigzag indicator with strong momentum.
- Price should pull back towards the broken support zone which is now a resistance zone and show signs of price rejection.
- The Patterns on the Chart Indicator should identify a bearish reversal candle as the price touches the area of the zone.
- Enter a sell order on the confirmation of these conditions.
Stop Loss
- Set the stop loss on the resistance level above the bearish reversal pattern.
Exit
- Close the trade as soon as a bullish reversal pattern develops.

Conclusion
A momentum breakout is one of the many possible scenarios that could occur in a support or resistance zone. However, traders would never really know for sure when the price would break out or reverse as it touches a support or resistance zone. This is why many market flow traders would wait for pullbacks and price rejections as a way to confirm the change in market flow direction.
Market flow breakouts and pullbacks can be quite difficult for new traders to trade. This strategy simply puts a structure for new traders so that it would be easier to trade this kind of trade setup. As such, if used correctly, this strategy can help traders identify high-probability trade setups that could yield consistent profits.
Recommended MT5 Broker
- Free $50 To Start Trading Instantly! (Withdrawable Profit)
- Deposit Bonus up to $5,000
- Unlimited Loyalty Program
- Award Winning Forex Broker
- Additional Exclusive Bonuses Throughout The Year

>> Claim Your $50 Bonus Here <<
Click here below to download:
Save
Save
- SEO Powered Content & PR Distribution. Get Amplified Today.
- PlatoData.Network Vertical Generative Ai. Empower Yourself. Access Here.
- PlatoAiStream. Web3 Intelligence. Knowledge Amplified. Access Here.
- PlatoESG. Carbon, CleanTech, Energy, Environment, Solar, Waste Management. Access Here.
- PlatoHealth. Biotech and Clinical Trials Intelligence. Access Here.
- Source: https://www.forexmt4indicators.com/zigzag-structure-break-pullback-forex-trading-strategy-for-mt5/?utm_source=rss&utm_medium=rss&utm_campaign=zigzag-structure-break-pullback-forex-trading-strategy-for-mt5
- :is
- :not
- :where
- $UP
- a
- above
- Action
- actual
- After
- again
- against
- All
- allows
- also
- an
- analysis
- and
- ARE
- AREA
- AS
- At
- automatically
- back
- based
- basis
- BE
- bearish
- because
- before
- below
- Bonus
- Break
- break out
- breakout
- breakouts
- Broken
- Bullish
- buy
- by
- called
- CAN
- capitalize
- causing
- certain
- change
- Chart
- claim
- commonly
- conditions
- Confirm
- confirmation
- conjunction
- connects
- considered
- consistent
- continuation
- Corner
- correctly
- Corresponding
- could
- Couple
- creates
- custom
- data
- decisions
- develop
- develops
- different
- difficult
- direction
- displays
- download
- Drop
- Earlier
- easier
- Effective
- effectively
- either
- Enter
- entry
- Exclusive
- fairly
- familiar
- Find
- flow
- For
- forex
- Forex Trading
- form
- from
- get
- happen
- help
- here
- High
- Highs
- historical
- How
- However
- HTTPS
- identified
- identifies
- identify
- identifying
- if
- important
- in
- Indicator
- Indicators
- IT
- Kind
- Know
- Labels
- left
- Level
- levels
- Line
- looking
- loss
- Lot
- Low
- Lows
- Loyalty
- major
- make
- Making
- many
- Market
- market moves
- max-width
- May..
- mentioned
- might
- Momentum
- more
- most
- move
- moves
- much
- name
- names
- never
- New
- now
- objectively
- occur
- occurring
- of
- off
- on
- ONE
- only
- or
- order
- our
- out
- Pattern
- patterns
- percentage
- PHP
- Pivot
- plato
- Plato Data Intelligence
- PlatoData
- points
- possible
- price
- PRICE ACTION
- Prior
- process
- Profit
- profits
- pullback
- Puts
- quite
- Reaches
- reacting
- really
- reference
- reject
- reliable
- requires
- Resistance
- Reversal
- reverse
- right
- scenarios
- Screen
- see
- sell
- setup
- several
- Short
- should
- show
- showed
- Signal
- signals
- Signs
- simplify
- simply
- skills
- So
- Soon
- specific
- start
- Stop
- Story
- Strategy
- strong
- structure
- such
- support
- support level
- sure
- Swing
- Take
- Technical
- Technical Analysis
- tell
- tend
- than
- that
- The
- The Area
- then
- therefore
- These
- they
- things
- this
- throughout
- Thus
- time
- timely
- to
- tool
- touches
- towards
- trade
- Traders
- trades
- Trading
- trading strategy
- us
- use
- used
- uses
- using
- valid
- variable
- very
- viewing
- wait
- Way..
- we
- when
- which
- WHO
- why
- will
- winning
- with
- Work
- would
- Yield
- Your
- zephyrnet
- zone
- zones
![Get $100 Bonus - No Deposit Needed! [For Singapore Residents Only] - ForexMT4Indicators.com](https://platoaistream.net/wp-content/uploads/2023/07/get-100-bonus-no-deposit-needed-for-singapore-residents-only-forexmt4indicators-com-360x111.png)