Ripple is struggling to stay above the $0.35 support against the US Dollar. XRP price must surpass $0.38 to start a fresh increase and avoid a downside break.
- Ripple is consolidating losses above the $0.35 support against the US dollar.
- The price is now trading below $0.38 and the 100 simple moving average (4-hours).
- There is a major bearish trend line forming with resistance near $0.3760 on the 4-hours chart of the XRP/USD pair (data source from Kraken).
- The pair could rally if there is a close above the $0.376 and $0.380 resistance levels.
Ripple Price Faces Resistance
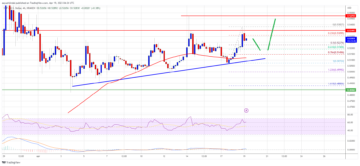
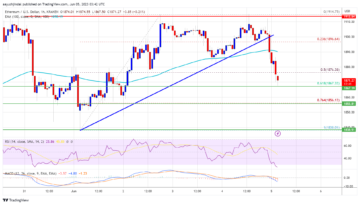
This week, ripple’s XRP faced resistance near the $0.3880 zone against the US Dollar. The price failed to gain bullish momentum and started a fresh decline below $0.380, unlike bitcoin and ethereum.
The bears were able to push the price below the $0.3750 support and the 100 simple moving average (4-hours). The price traded as low as $0.3571 and is currently consolidating losses. XRP price is now trading below $0.38 and the 100 simple moving average (4-hours).
On the upside, an initial resistance is near the $0.3700 zone. The first major resistance is near the $0.3725 level and the 100 simple moving average (4-hours). It is near the 50% Fib retracement level of the downward move from the $0.3880 swing high to $0.3751 low.
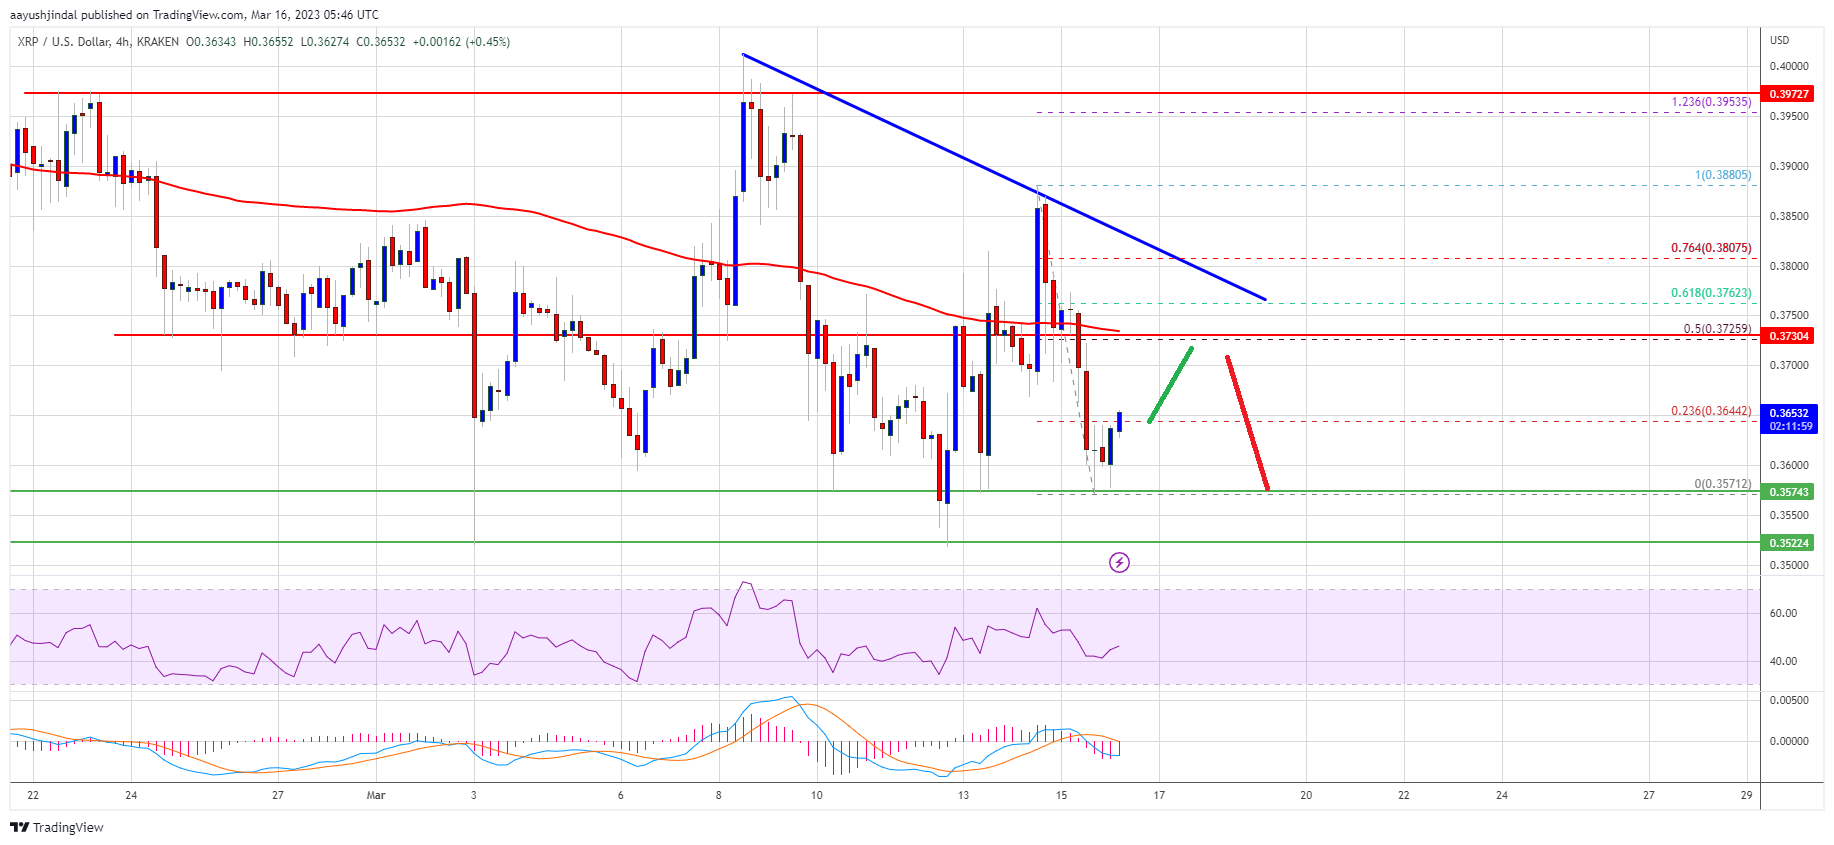
Source: XRPUSD on TradingView.com
The next key resistance is near the $0.3750 level. There is also a major bearish trend line forming with resistance near $0.3760 on the 4-hours chart of the XRP/USD pair. A successful break above the $0.376 resistance might send the price towards the $0.388 resistance. Any more gains might send the price towards the $0.400 level.
Downside Break in XRP?
If ripple fails to clear the $0.376 resistance zone, it could continue to move down. An initial support on the downside is near the $0.357 level.
The next major support is near $0.352. If there is a downside break and close below the $0.352 level, xrp price could extend losses. In the stated case, the price could even decline below the $0.340 support and retest the $0.320 support.
Technical Indicators
4-Hours MACD – The MACD for XRP/USD is now losing pace in the bullish zone.
4-Hours RSI (Relative Strength Index) – The RSI for XRP/USD is now below the 50 level.
Major Support Levels – $0.357, $0.352 and $0.340.
Major Resistance Levels – $0.372, $0.376 and $0.400.
- SEO Powered Content & PR Distribution. Get Amplified Today.
- Platoblockchain. Web3 Metaverse Intelligence. Knowledge Amplified. Access Here.
- Source: https://www.newsbtc.com/analysis/xrp/xrp-price-prediction-vulnerable-0-35/
- :is
- 100
- a
- Able
- above
- against
- and
- AS
- average
- avoid
- bearish
- Bears
- below
- bias
- Break
- Bullish
- case
- Chart
- clear
- Close
- consolidating
- continue
- could
- Currently
- data
- Decline
- Dollar
- down
- downside
- downward
- Even
- extend
- faced
- faces
- Failed
- fails
- First
- For
- fresh
- fresh increase
- from
- Gain
- Gains
- High
- HTTPS
- in
- Increase
- index
- initial
- IT
- Key
- key resistance
- Kraken
- Level
- levels
- Line
- losing
- losses
- Low
- MACD
- major
- max-width
- might
- Momentum
- more
- move
- moving
- moving average
- Near
- NewsBTC
- next
- of
- on
- Pace
- past
- plato
- Plato Data Intelligence
- PlatoData
- prediction
- price
- Price Prediction
- Push
- rally
- relative strength index
- Resistance
- retracement
- Ripple
- rsi
- Simple
- Source
- start
- started
- stated
- stay
- strength
- Struggling
- successful
- support
- support levels
- Surges
- surpass
- The
- to
- towards
- traded
- Trading
- TradingView
- Trend
- Upside
- us
- US Dollar
- Vulnerable
- week
- with
- xrp
- XRP Price
- XRP price prediction
- XRP/USD
- zephyrnet