SNEAK PEEK
- APT’s blockchain potential generates enthusiasm for possible highs.
- Bulls dominate the APT market, increasing prices and igniting an extended bull run.
- Stabilized sentiment and rising volume steer APT toward new heights.
The decoupling of Aptos from Microsoft’s partnership to build A.I. tools for blockchain integrations initially sparked fear of missing out (FOMO) among the crowd. However, as time has passed, the excitement has subsided, and the market sentiment has stabilized. Nonetheless, the increasing volume and development activity in Aptos suggests a potential for reaching new highs.
📈🧑💻 #Aptos has decoupled after its partnership with #Microsoft was announced to build A.I. tools for #blockchain integrations. The crowd showed major #FOMO, but has calmed down. However, rising volume & dev. activity may foreshadow another higher high. https://t.co/vFgMZQo7Io pic.twitter.com/Ub2MGu0QFC
— Santiment (@santimentfeed) August 10, 2023
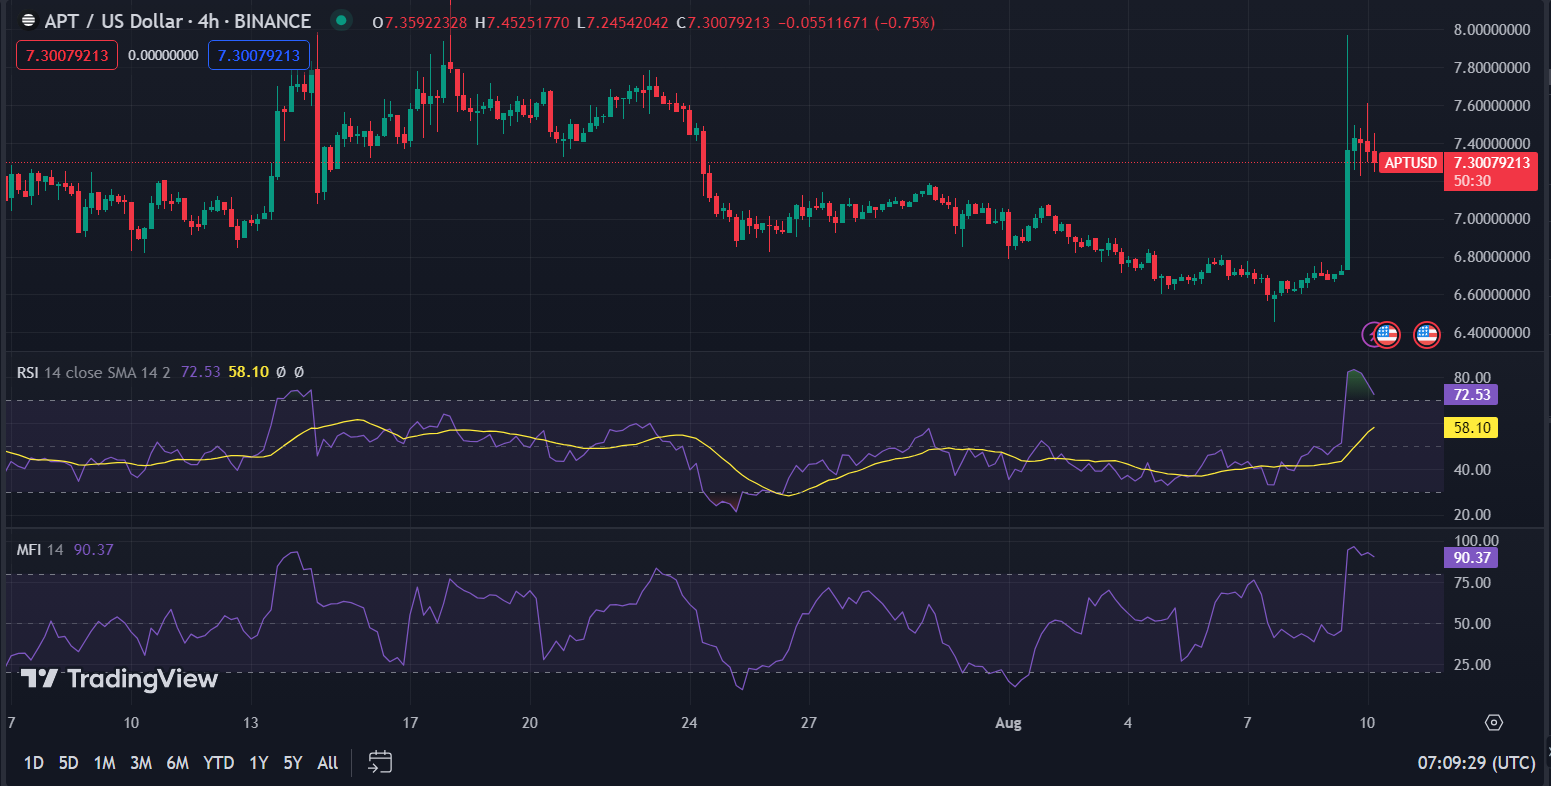
Consequently, bulls dominated the Aptos (APT) market over the past 24 hours, pushing prices from a low of $6.67 to a high of $7.75. The persistent pressure on the bulls had driven the price up to $7.28 during this writing, an 8.96% increase.
This increase inspired traders to join the rally in the prospect of a lengthy bull run, driving market capitalization and 24-hour trading volume to rise by 9.74% and 775.54%, respectively, to $1,602,586,028 and $738,029,773. This unexpected increase may be ascribed to rising demand as more investors become interested in the potential for long-term returns.
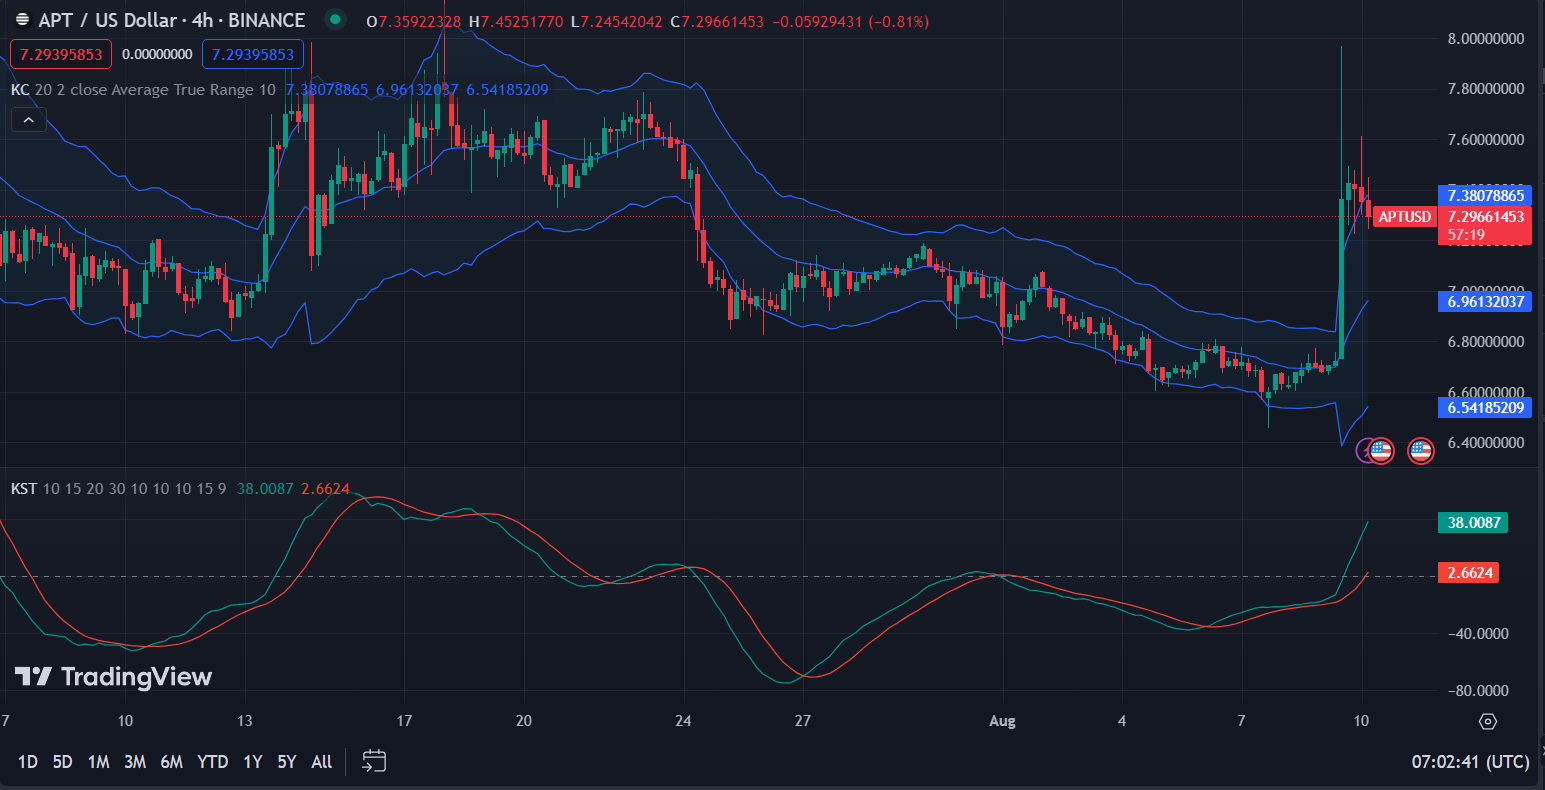
The Know Sure Thing (KST), with a reading of 38.0087 and a movement above its signal line, indicates that the APT market’s bullish momentum is strengthening. If the KST line falls below the signal line, investors may consider closing out existing long positions or opening new ones.
The Keltner Channel bands are expanding while trending north on the 4-hour price chart for APT, indicating a bullish trend, with upper and lower readings of 7.38078865 and 6.5418565, respectively. Traders may consider purchasing APT now with a sell target price near the upper Keltner Channel.
As the price of APT rises above the middle band on the price chart, the formation of green candlesticks strengthens the bullish momentum. However, traders should know potential resistance levels and employ a stop loss to mitigate risk when the bull’s strength wanes.
The bullish momentum is supported by the RSI reading of 72.53, which is above the 50-point threshold and advances above its signal line, indicating more significant buying pressure than selling pressure. However, when the RSI crosses below its signal line, the positive momentum may wane, requiring traders to set a stop loss.
On the 4-hour price chart for APT, the Money Flow Index (MFI) reading of 90.37 indicates that buyers control the market. Until the MFI dips below 50, traders may choose to hold in current long positions or open new ones.
In conclusion, APT’s journey from FOMO to stabilizing sentiment highlights potential highs ahead. Bull’s rally signals strong momentum for a rewarding ride.
Disclaimer: Cryptocurrency price is highly speculative and volatile and should not be considered financial advice. Past and current performance is not indicative of future results. Always research and consult with a financial advisor before making investment decisions.
- SEO Powered Content & PR Distribution. Get Amplified Today.
- PlatoData.Network Vertical Generative Ai. Empower Yourself. Access Here.
- PlatoAiStream. Web3 Intelligence. Knowledge Amplified. Access Here.
- PlatoESG. Automotive / EVs, Carbon, CleanTech, Energy, Environment, Solar, Waste Management. Access Here.
- BlockOffsets. Modernizing Environmental Offset Ownership. Access Here.
- Source: https://investorbites.com/aptos-apt-price-analysis-10-08/
- :has
- :is
- :not
- $UP
- 10
- 22
- 24
- 28
- 50
- 60
- 67
- 7
- 72
- 75
- 8
- 9
- 90
- a
- A.I
- above
- activity
- advances
- advice
- advisor
- After
- ahead
- always
- among
- an
- analysis
- and
- announced
- Another
- APT
- Aptos
- ARE
- AS
- BAND
- BE
- become
- before
- below
- blockchain
- Blockchain News
- build
- bull
- Bull Run
- Bullish
- Bulls
- but
- buyers
- Buying
- by
- capitalization
- Center
- Channel
- Chart
- Choose
- closing
- conclusion
- Consider
- considered
- control
- crowd
- Current
- decisions
- decoupled
- Demand
- Dev
- Development
- development activity
- dominate
- down
- driven
- driving
- during
- enthusiasm
- Ether (ETH)
- Excitement
- existing
- expanding
- external
- Falls
- fear
- financial
- financial advice
- flow
- FOMO
- For
- formation
- from
- future
- generates
- Green
- had
- heights
- High
- higher
- highlights
- highly
- Highs
- hold
- HOURS
- However
- HTTPS
- i
- if
- igniting
- in
- Increase
- increasing
- index
- indicates
- indicating
- indicative
- initially
- inspired
- integrations
- interested
- internal
- investment
- investor
- Investors
- ITS
- join
- journey
- Know
- levels
- Line
- Long
- long-term
- loss
- Low
- lower
- major
- Making
- Market
- Market Capitalization
- Market News
- market sentiment
- May..
- Middle
- missing
- Mitigate
- Momentum
- money
- more
- movement
- Near
- New
- news
- North
- now
- of
- on
- ones
- open
- opening
- or
- out
- over
- Partnership
- passed
- past
- performance
- plato
- Plato Data Intelligence
- PlatoData
- positions
- positive
- possible
- potential
- pressure
- price
- Price Analysis
- price chart
- Prices
- prospect
- purchasing
- Pushing
- rally
- reaching
- Reading
- research
- Resistance
- Results
- returns
- rewarding
- Ride
- Rise
- Rises
- rising
- Risk
- rsi
- Run
- s
- Santiment
- sell
- Selling
- sentiment
- set
- should
- showed
- Signal
- signals
- significant
- Source
- sparked
- speculative
- Stop
- strength
- strengthening
- Strengthens
- strong
- subsided
- Suggests
- Supported
- sure
- surge
- Target
- than
- that
- The
- thing
- this
- threshold
- time
- to
- tools
- toward
- Traders
- Trading
- trading volume
- TradingView
- Trend
- trending
- Unexpected
- until
- volatile
- volume
- was
- when
- which
- while
- with
- writing
- zephyrnet