- Bitcoin cash price started a fresh decline from the $354 resistance against the US Dollar.
- The price is now trading below the $340 zone and the 55 simple moving average (4-hours).
- There is a key bearish trend line forming with resistance near $338 on the 4-hours chart of the BCH/USD pair (data feed from Coinbase).
- The pair remains at a risk of a downside break below the $315 support zone in the near term.
Bitcoin cash price is struggling below $330 against the US Dollar, similar to bitcoin. BCH/USD could extend losses if there is a clear move below $315.
Bitcoin Cash Price Analysis
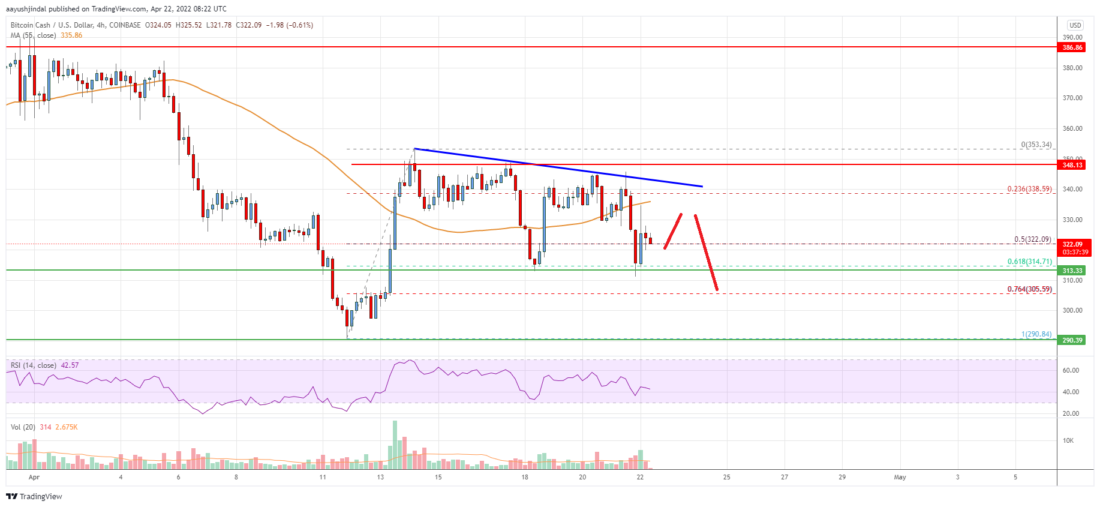
Bitcoin cash price made a few attempts to gain strength above $350 and $355. However, BCH failed to gain pace and started a fresh decline below the $340 level.
There was a move below the $330 level and the 55 simple moving average (4-hours). The price even traded below the 50% Fib retracement level of the upward move from the $290 swing low to $354 high. It is now trading below the $330 level and the 55 simple moving average (4-hours).
There is also a key bearish trend line forming with resistance near $338 on the 4-hours chart of the BCH/USD pair. An immediate support on the downside is near the $315 zone.
The 61.8% Fib retracement level of the upward move from the $290 swing low to $354 high is also near $315. The next major support is near the $300 level, below which the bears gain strength. The next target for them may perhaps be near the $290 level.
On the upside, the price is now facing resistance near the $330 level. The next major resistance is near the $336 level and the 55 simple moving average (4-hours).
A clear break above $336 and $340 might start a fresh increase. In the stated case, the price could even clear the $350 resistance zone. The next major hurdle is near the $380 level.

Bitcoin Cash Price
Looking at the chart, bitcoin cash price is now trading below the $330 zone and the 55 simple moving average (4-hours). Overall, the price remains at a risk of a downside break below the $315 support zone in the near term.
Technical indicators
4 hours MACD – The MACD for BCH/USD is slowly losing pace in the bearish zone.
4 hours RSI (Relative Strength Index) – The RSI for BCH/USD is now below the 50 level.
Key Support Levels – $315 and $300.
Key Resistance Levels – $340 and $350.
The post Bitcoin Cash Analysis: Bears Aim Larger Decline Below $315 appeared first on Live Bitcoin News.