Data shows the Bitcoin NVT Golden Cross indicator has recently dipped inside the undervalued zone, a sign that could be bullish for the price.
Bitcoin NVT Golden Cross Has Entered The Bullish Territory
An analyst in a CryptoQuant Quicktake post explained that the NVT Golden Cross has recently indicated upside potential. The “Network Value to Transactions” (NVT) is an indicator that keeps track of the ratio between the Bitcoin market cap and transaction volume.
This metric is often used to determine whether the current price is fair. When the NVT has a high value, it means that the value of the cryptocurrency (the market cap) is high compared to its ability to transact coins (the transaction volume). Thus, the coin’s spot price may be considered overvalued in such conditions.
On the other hand, the ratio having a low value implies the asset may be underpriced right now as the market cap isn’t too high when compared to the transfer volume.
In the context of the current discussion, the NVT itself isn’t of interest, but rather a modified form called the “NVT Golden Cross” is. This metric compares the NVT’s short-term trend (10-day moving average) with its long-term trend (30-day MA).
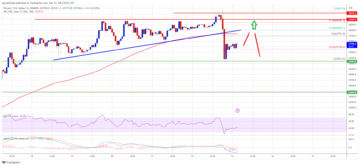
Now, here is a chart that shows the trend in the NVT Golden Cross over the last few years:
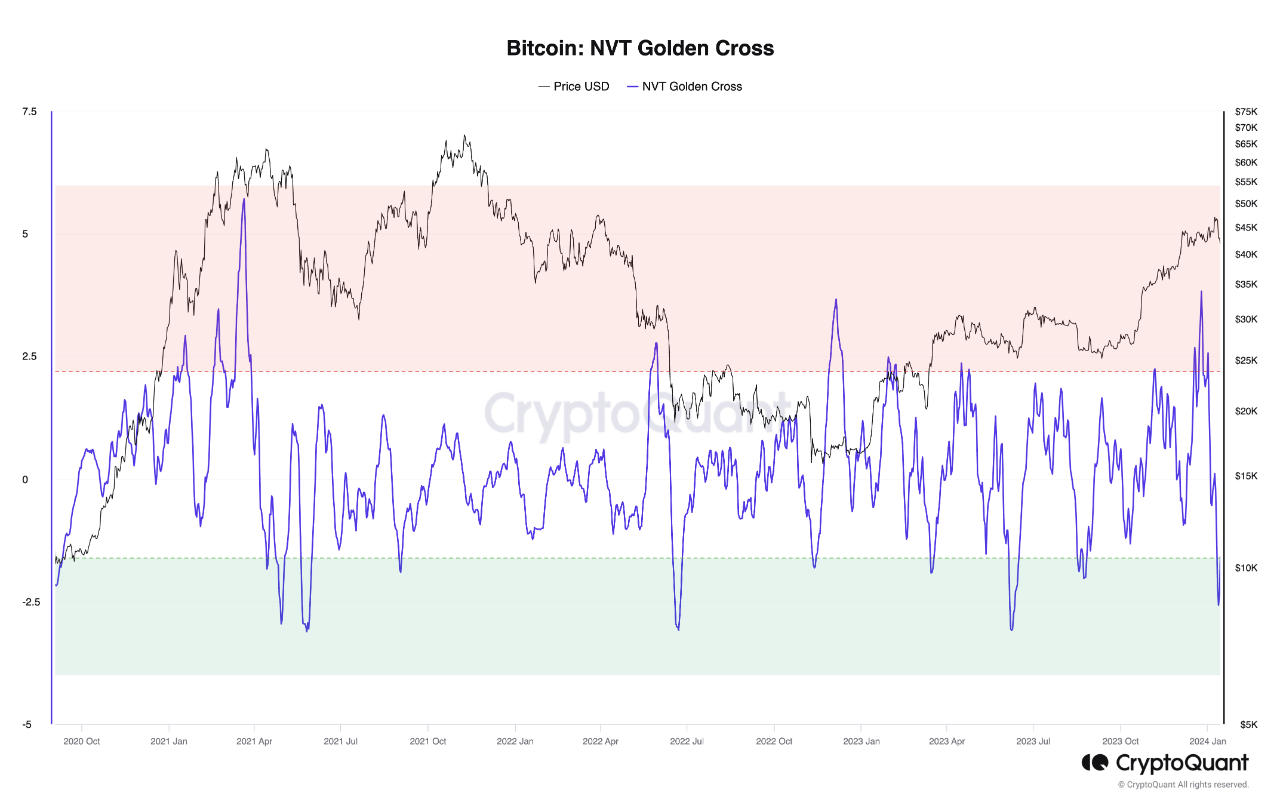
Looks like the value of the metric has taken a plunge in recent days | Source: CryptoQuant
Historically, the Bitcoin NVT Golden Cross has had two major zones relevant to the cryptocurrency’s price, as the quant has highlighted in the graph. A higher indicator value than 2.2 suggests the asset is overvalued and may be prone to forming at least a local top.
Similarly, its being under the -1.6 level can indicate that the coin may be undervalued and thus more likely to show some turnaround. The major lows in 2023 occurred near when the metric dipped inside this territory.
The chart shows that the indicator’s value has plummeted recently and has dived inside this latter zone. At the peak of this negative spike, the NVT Golden Cross had touched -2.5, which meant that it had notably fallen below the -1.6 threshold.
As is visible in the graph, this latest negative peak of the NVT Golden Cross exceeds what was observed during August, but it’s still below the levels seen around the bottom of June.
If the historical pattern is anything to go by, the latest low NVT Golden Cross values could indicate that a bottom is near for the cryptocurrency, if not already behind it.
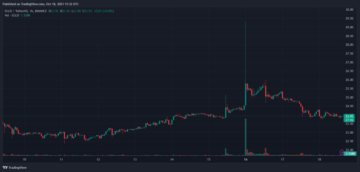
BTC Price
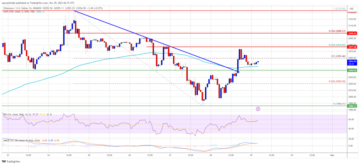
Bitcoin has been stuck in sideways movement during the last few days as the coin has been unable to pick any direction. At present, the asset is floating around the $42,600 level.
The price of the coin seems to have gone stale during the last few days | Source: BTCUSD on TradingView
Featured image from Shutterstock.com, charts from TradingView.com, CryptoQuant.com
Disclaimer: The article is provided for educational purposes only. It does not represent the opinions of NewsBTC on whether to buy, sell or hold any investments and naturally investing carries risks. You are advised to conduct your own research before making any investment decisions. Use information provided on this website entirely at your own risk.
- SEO Powered Content & PR Distribution. Get Amplified Today.
- PlatoData.Network Vertical Generative Ai. Empower Yourself. Access Here.
- PlatoAiStream. Web3 Intelligence. Knowledge Amplified. Access Here.
- PlatoESG. Carbon, CleanTech, Energy, Environment, Solar, Waste Management. Access Here.
- PlatoHealth. Biotech and Clinical Trials Intelligence. Access Here.
- Source: https://www.newsbtc.com/bitcoin-news/bitcoin-nvt-golden-cross-bullish-rally-restart/
- :has
- :is
- :not
- 1
- 2023
- a
- ability
- advised
- already
- an
- analyst
- and
- any
- anything
- ARE
- around
- article
- AS
- asset
- At
- AUGUST
- average
- BE
- been
- before
- behind
- being
- below
- between
- Bitcoin
- Bitcoin market
- bitcoin market cap
- Bitcoin Price
- Bottom
- Bullish
- but
- buy
- by
- called
- CAN
- cap
- Chart
- Charts
- Coin
- Coins
- COM
- compared
- conditions
- Conduct
- considered
- context
- could
- Cross
- cryptocurrency
- cryptoquant
- Current
- Days
- decisions
- Determine
- direction
- discussion
- does
- during
- educational
- entered
- entirely
- exceeds
- explained
- fair
- Fallen
- few
- floating
- For
- form
- from
- Go
- Golden
- golden cross
- gone
- graph
- had
- hand
- Have
- having
- here
- High
- high value
- higher
- Highlighted
- historical
- hold
- HTTPS
- if
- image
- in
- indicate
- indicated
- Indicator
- information
- inside
- interest
- investing
- investment
- Investments
- IT
- ITS
- itself
- june
- Last
- latest
- least
- Level
- levels
- like
- likely
- local
- long-term
- Low
- Lows
- major
- Making
- Market
- Market Cap
- May..
- means
- meant
- metric
- modified
- more
- movement
- moving
- moving average
- naturally
- Near
- negative
- NewsBTC
- notably
- now
- NVT
- observed
- occurred
- of
- often
- on
- only
- Opinions
- or
- Other
- over
- own
- Pattern
- Peak
- pick
- plato
- Plato Data Intelligence
- PlatoData
- plunge
- potential
- present
- price
- price chart
- provided
- purposes
- Quant
- rally
- rather
- ratio
- recent
- recently
- relevant
- represent
- research
- right
- Risk
- risks
- seems
- seen
- sell
- short-term
- show
- Shows
- shutterstock
- sideways
- sign
- Signal
- some
- Source
- spike
- Spot
- Still
- such
- Suggests
- taken
- territory
- than
- that
- The
- The Graph
- this
- threshold
- Thus
- to
- too
- top
- touched
- track
- TradingView
- transact
- transaction
- transfer
- Trend
- two
- unable
- under
- Upside
- use
- used
- value
- Values
- visible
- volume
- was
- Website
- What
- when
- whether
- which
- with
- years
- you
- Your
- zephyrnet
- zones