On-chain data shows exchanges have now observed large Bitcoin outflows for the third straight week as price continues to recover.
Bitcoin Exchange Netflow Remains Negative For 3rd Consecutive Week
As per the latest weekly report from Glassnode, the BTC netflow has continued to show negative values for the third straight week now.
The “exchange net position change” (or simply the netflow) is an indicator that measures the net amount of Bitcoin that’s entering or exiting wallets of all exchanges.
When the value of this metric is positive, it means exchanges are currently observing more inflows than the outflows. Such a trend can be bearish as investors usually deposit their BTC for selling purposes.
On the other hand, when the value of the indicator turns negative, it implies a net amount of coins is exiting exchange wallets as outflows dominate the inflows.
This trend, when sustained, may prove to be bullish for the price of the crypto as investors usually transfer their Bitcoin to personal wallets for accumulation purposes.
Related Reading | A Constant Rise in Russian’ Inactive Bitcoin Wallets For The Last 18 Months
Now, here is a chart that shows the trend in the BTC exchange net position change indicator over the past year:
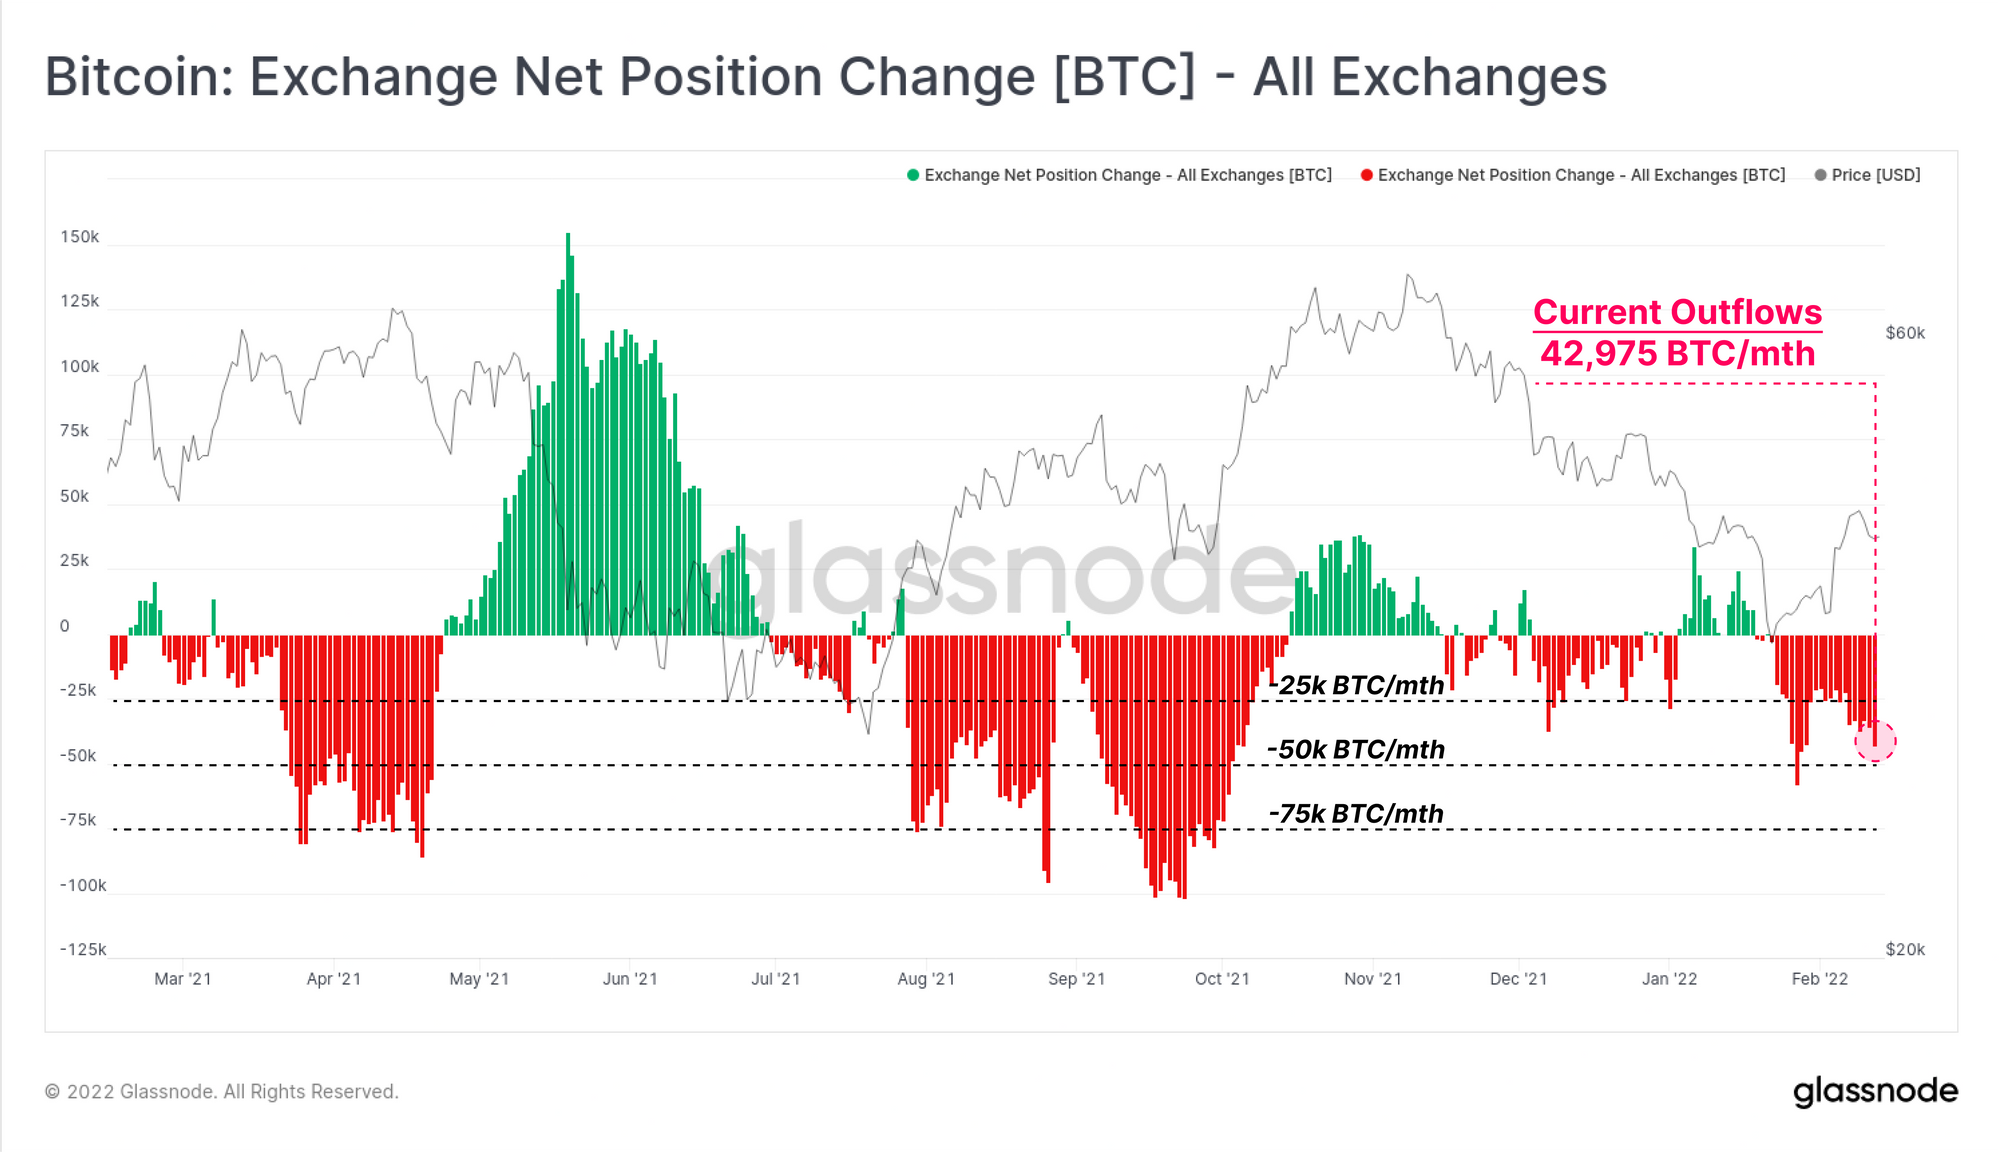
The value of the indicator seems to have been deep in the red for a while now | Source: The Glassnode Week Onchain - Week 7, 2022
As you can see in the above graph, the Bitcoin netflow value looks to be quite negative at the moment. This week marks the third straight to have observed such values.
Since outflows are usually bullish, these recent large ones seem to have been the push behind the BTC recovery from the crash to $33k.
Related Reading | Here’s What Bitcoin And Joe Rogan Haven In Common
And as the indicator is still sustaining at quite the substantial values, this trend of bullish recovery may continue to go on still.
BTC Price
At the time of writing, Bitcoin’s price floats around $44.3k, up 1% in the last seven days. Over the past month, the crypto has gained 3% in value.
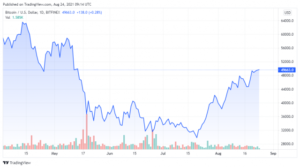
The below chart shows the trend in the price of BTC over the last five days.
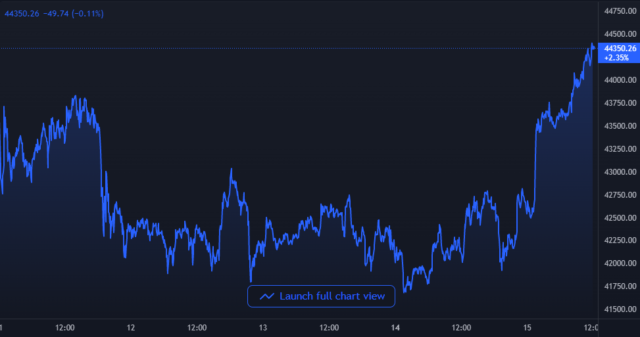
Looks like the price of the coin has surged up over the past 24 hours | Source: BTCUSD on TradingView
After recovering back above the $45k mark a few days back, Bitcoin’s price again had a slump as the price slipped down below $42k. But in the past day, the crypto has shown some sharp uptrend as it readies itself to retest $45k.
Currently, it’s unclear whether this time BTC will be able to sustain above the $45k mark, or if it will drop back down again. However, if the outflows are anything to go by, the outlook is looking to be bullish for the coin.
Featured image from Unspash.com, charts from TradingView.com, Glassnode.com
- 7
- All
- around
- bearish
- Bitcoin
- Bitcoin Price
- bitcoin wallets
- BTC
- Bullish
- change
- Charts
- Coin
- Coins
- continue
- continues
- Crash
- crypto
- data
- day
- dominate
- down
- Drop
- exchange
- Exchanges
- Glassnode
- here
- HTTPS
- image
- Investors
- IT
- joe rogan
- large
- latest
- looking
- mark
- more
- net
- Onchain
- Other
- Outlook
- personal
- price
- purposes
- Reading
- Recover
- recovery
- report
- substantial
- time
- usually
- value
- Wallets
- week
- weekly
- What
- whether
- writing
- year