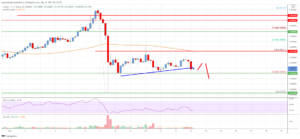
- Bitcoin price started a recovery wave above the $30,000 zone against the US Dollar.
- The price is now trading above $30,000 and the 55 simple moving average (4-hours).
- There was a break above a major bearish trend line with resistance near $29,750 on the 4-hours chart of the BTC/USD pair (data feed from Coinbase).
- The pair could start a steady increase if there is a move above the $32,250 level.
Bitcoin price is struggling below $32,000 against the US Dollar. BTC might extend losses if it stays below the $32,250 and $32,650 resistance levels.
Bitcoin Price Analysis
Bitcoin price extended its decline below the $30,000 support zone. A low was formed near the $25,350 zone before there was a recovery wave.
The price climbed above the $28,000 and $29,000 resistance levels. There was a move above the 23.6% Fib retracement level of the downward move from the $40,040 swing high to $25,335 low. Besides, there was a break above a major bearish trend line with resistance near $29,750 on the 4-hours chart of the BTC/USD pair.
Bitcoin is now trading above $30,000 and the 55 simple moving average (4-hours). An immediate resistance on the upside is near the $32,250 level.
The next major resistance on the upside is near the $32,650 level. It is near the 50% Fib retracement level of the downward move from the $40,040 swing high to $25,335 low. To start another increase, the price must settle above the $32,650 level in the near term.
In the stated case, bitcoin could rise towards the $34,000 resistance or even $35,000. The next major resistance sits near the $37,500 level.
If there is no upside break, the price might start a fresh decline below $31,000. The next key support is near the $30,000 level. Any more losses might call for a test of the $28,500 support zone. An intermediate support sits near the $27,500 level.

Bitcoin Price
Looking at the chart, bitcoin price is clearly trading above $30,000 and the 55 simple moving average (4-hours). Overall, the price could start a steady increase if there is a move above the $32,250 level.
Technical Indicators
4 hours MACD – The MACD is now gaining momentum in the bullish zone.
4 hours RSI (Relative Strength Index) – The RSI is now above the 50 level.
Key Support Levels – $31,000 and $28,500.
Key Resistance Levels – $32,250, $32,650 and $34,000.
The post Bitcoin Price Analysis: BTC Faces Key Challenge Near $32,200 appeared first on Live Bitcoin News.
- 000
- analysis
- Another
- average
- bearish
- before
- below
- Bitcoin
- Bitcoin Price
- Bitcoin Price Analysis
- BTC
- BTC/USD
- Bullish
- call
- challenge
- coinbase
- could
- data
- Dollar
- extend
- faces
- First
- fresh
- gaining
- High
- HTTPS
- immediate
- Increase
- index
- IT
- Key
- Level
- Line
- major
- might
- Momentum
- more
- move
- moving
- Near
- overall
- price
- Price Analysis
- recovery
- Simple
- start
- started
- stated
- strength
- support
- test
- towards
- Trading
- us
- US Dollar
- Wave