Over the past month, Bitcoin has been experiencing a steep decline with significant bearish momentum. In fact, this was the worst-ever quarter for the primary cryptocurrency.
However, after dropping below the 2017 all-time high area amid $20K, the bearish momentum has begun to diminish with a choppy price action alongside consolidation. After ending another red-candle week, can BTC finally see some green?
Technical Analysis
Technical and on-chain analysis by Shayan
The Daily Chart
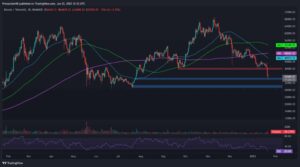
Although the price has plummeted by almost 74% since recording its ATH in November 2021, reaching the undervalued zone based on many price models, there are still no signs of a possible trend reversal.
This, besides the amplified negative sentiment and lack of demand, increases the odds of another bearish leg resulting in the breakdown of the $17K crucial level, which marks this bear market’s low. If this happens – it will likely push the price of BTC below the current support area and towards the $15K mark.

The 4-Hour Chart
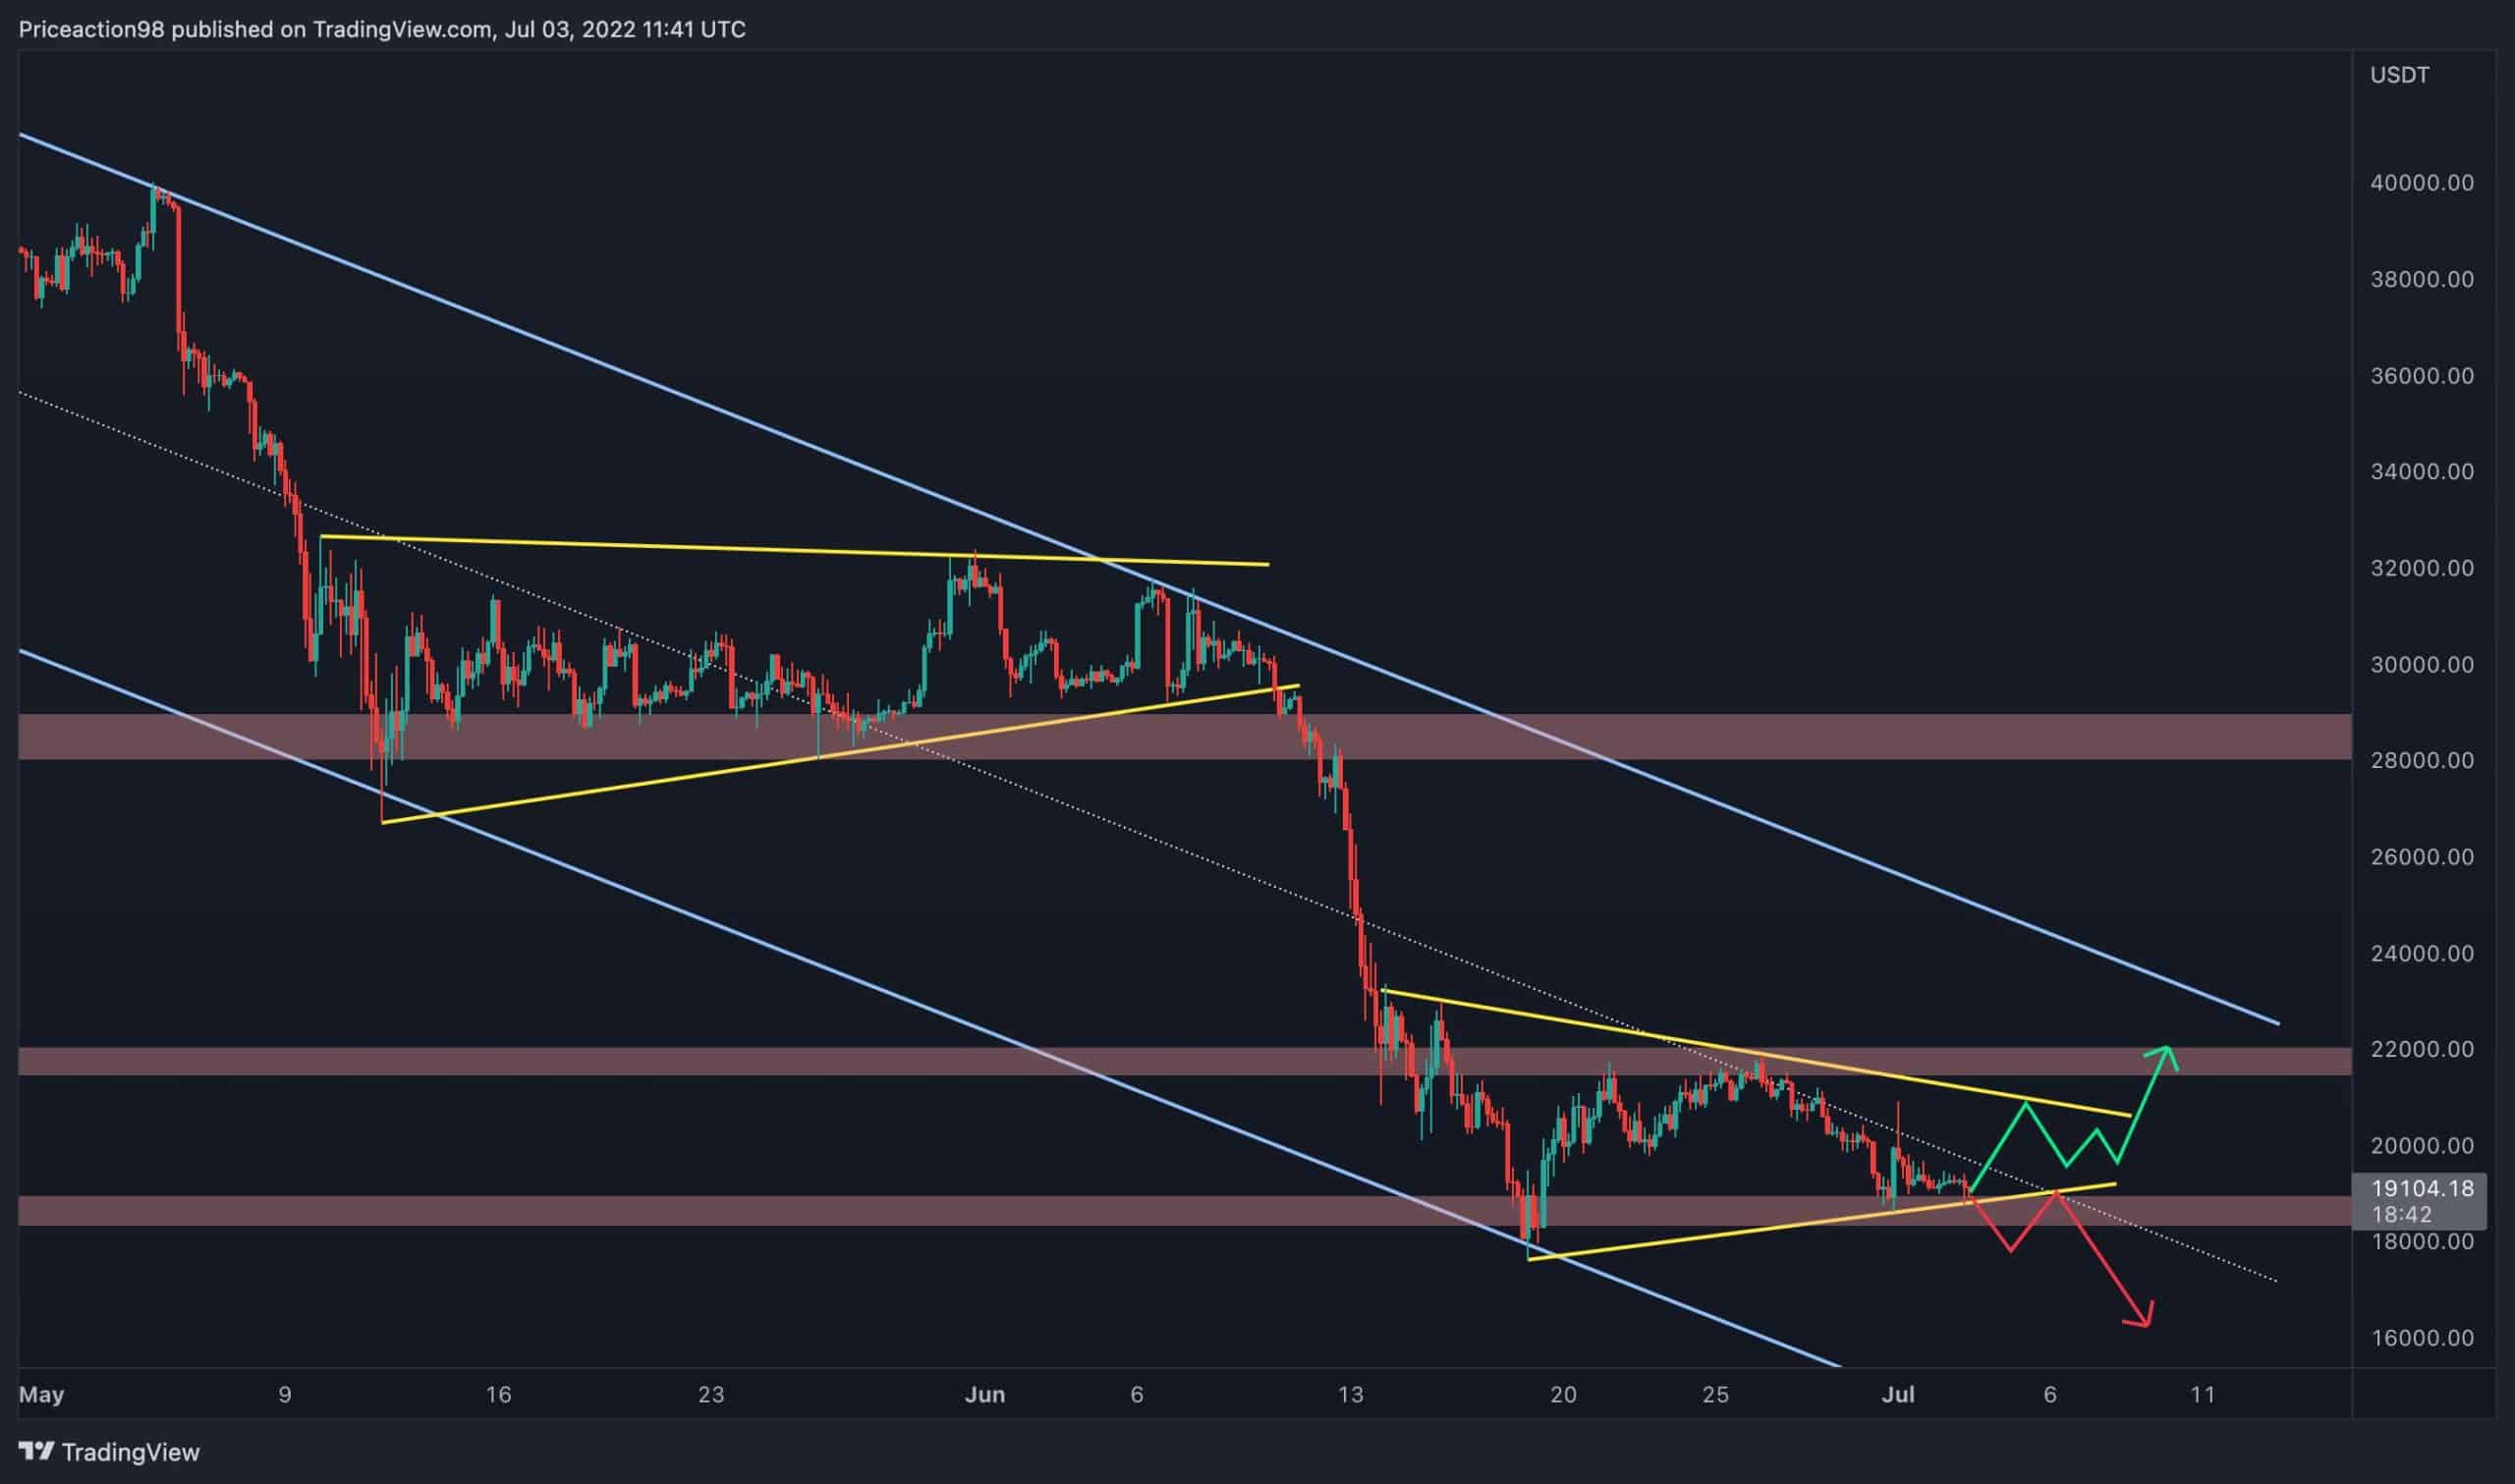
The $18K level has significantly supported Bitcoin’s price over the last couple of days. Nevertheless, the price hasn’t been successful in breaking the channel’s middle boundary, and there are no signs of a reversal pattern on the lower timeframes’ charts.
Markets usually form a correction pattern right after an expansion move. Bitcoin is forming a triangle correction pattern, as it did in the second half of May when the price was consolidating above the $28K level. Going forward, there are two likely scenarios:
- Bullish: The price breaks above the channel’s mid-trendline and the triangle’s upper boundary and attempts to break the $22K sentimental resistance level aiming for the channel’s upper boundary.
- Bearish: The price fails to initiate a new bullish move and breaks below the triangle, turning the $17K level into a critical resistance.
Therefore, the triangle’s breakout will determine Bitcoin’s next move direction.
Onchain Analysis
The Whale Ratio metric is a proxy of big players’ selling behavior. It is calculated by dividing bitcoin’s top 10 inflows to exchanges by all the daily inflows. Historically, high values of the whale ratio metric have led to extreme price volatility.
Since Bitcoin failed to break the $48K level (a manifest bull trap) and started dropping towards the current area of the previous 2017 ATH, the Whale Ratio has spiked many times, acting as a catalyst for the bearish run. In this situation, it is concluded that the whales are depositing BTC to exchanges rapidly, increasing selling pressure.
Nevertheless, when big players start to capitulate and realize massive losses, Bitcoin will likely find a bottom for the next bullish cycle.

- "
- 10
- 2021
- a
- Action
- affect
- Aiming
- All
- alongside
- Amid
- analysis
- Another
- AREA
- bearish
- Bearish Momentum
- below
- Bitcoin
- Bitcoin Price
- Bitcoin Price Analysis
- Breakdown
- breakout
- breaks
- BTC
- bull
- Bullish
- calculated
- Catalyst
- Charts
- coming
- concluded
- consolidation
- Couple
- critical
- crucial
- cryptocurrency
- Current
- daily
- Days
- decision
- Demand
- Determine
- DID
- Exchanges
- expansion
- experiencing
- extreme
- facing
- Finally
- form
- Forward
- going
- Green
- High
- historically
- HTTPS
- huge
- increasing
- IT
- Led
- Level
- likely
- losses
- mark
- massive
- models
- Momentum
- Month
- move
- negative
- Nevertheless
- next
- Odds
- On-Chain
- Pattern
- players
- possible
- pressure
- previous
- price
- Price Analysis
- primary
- proxy
- Quarter
- realize
- resulting
- Run
- Selling
- sentiment
- significant
- Signs
- since
- situation
- some
- start
- started
- Still
- successful
- support
- Supported
- The
- times
- top
- towards
- usually
- Volatility
- week
- whales