TL;DR Breakdown
- Bitcoin price analysis reveals a bearish momentum engulfing the market.
- Bitcoin to retest the $49,000 resistance if the support persists.
- Strong support is currently found at $48,535.
The Bitcoin price analysis reveals that the king of cryptocurrency is under immense bearish pressure. In the past 24-hours price had fallen as low as $47,235, but the king recovered quickly. The analysis further reveals a reverse head and shoulder pattern forming on the BTC/USD price chart. A reverse head and shoulders is a bullish sign, and the king is likely to retest the $49,200 and beyond if the current support found at the $48,535 persists.

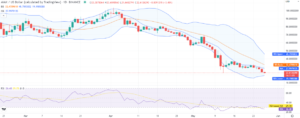
Bitcoin price analysis: 1 day chart reveals promising elements for bulls
The one-day candlesticks chart reveals promising elements for the bullish momentum to gear up and take the lead in the hours to come. Both the Bollinger bands’ average and the moving average are currently serving as strong support points for the cryptocurrency. The Bollinger bands average is found at the $46,863 mark, while the moving average is found at the $48,253 mark.

Moreover, the volatility is gradually decreasing in the given scenario, with the bulls trying to overcome the dominating market trend. The upper Bollinger band is found at the $50,554 mark, while the lower Bollinger band is found at the $43,172 mark. The king of cryptocurrency is trading hands at $48,952 at the time of writing. The relative strength index (RSI) stands at the value of 63.59 score which is well below the overbought limit and provides ample opportunity for a bullish trend to take form.
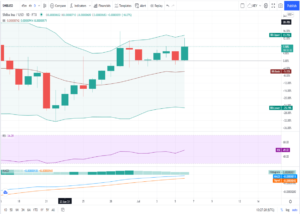
BTC/USD price on 4-hours candlestick chart reaffirms the bullish opportunities
On the four-hour candlestick chart, the king of cryptocurrency further confirms bullish opportunities. The volatility is also much lower than the 1-day chart but still higher than the previous day. The upper Bollinger band value is found at the $50,665 mark, while the lower value is found at the $47,407 mark. Both the Bollinger bands’ average and moving average are serving as strong support points on the four-hour chart as well. The Bollinger band average is found at $49,306 and the moving average (MA) at the $48,365 mark.

The relative strength index is still presenting ample opportunity for the bullish momentum to take form with a score of 53.94. The score is below the overbought zone by a good margin and presents a good opportunity for buyers to take the lead in the trading and turn the tables in their own favor.
Bitcoin price analysis conclusion
The three different Bitcoin price analysis patterns reveal that the king of cryptocurrency is likely to stay ahead of the game when it comes to retesting the $49,200 mark. It appears that the king is breathing heavily after taking a beating before it retests the psychological barrier. The inverse head and shoulder pattern hold supreme value in the upcoming bullish trends, whereas the 1-day and 4-hour candlestick chart analyses also reveal promising elements for the bulls to take control of the price charts.
Disclaimer. The information provided is not trading advice. Cryptopolitan.com holds no liability for any investments made based on the information provided on this page. We strongly recommend independent research and/or consultation with a qualified professional before making any investment decisions.
Source: https://api.follow.it/track-rss-story-click/v3/tHfgumto13DxtkaSgAMsuC1Ly282xAAw
- 000
- advice
- analysis
- bearish
- Bearish Momentum
- Bitcoin
- Bitcoin Price
- breathing
- BTC
- BTC/USD
- Bullish
- Bulls
- Charts
- cryptocurrency
- Cryptopolitan
- Current
- data
- day
- form
- game
- Gear
- good
- head
- hold
- HTTPS
- index
- information
- investment
- Investments
- IT
- King
- lead
- liability
- Making
- mark
- Market
- Momentum
- opportunities
- Opportunity
- Pattern
- pressure
- price
- Price Analysis
- Relative Strength Index (RSI)
- research
- reverse
- serving
- stay
- support
- Supreme
- time
- Trading
- Trends
- value
- Volatility
- writing