Bitcoin price is struggling below the $26,150 support. BTC could start another decline if it breaks the key $25,400 support in the near term.
- Bitcoin is moving lower below the $26,150 support zone.
- The price is trading below $26,000 and the 100 hourly Simple moving average.
- There is a key bearish trend line forming with resistance near $26,000 on the hourly chart of the BTC/USD pair (data feed from Kraken).
- The pair could decline again if there is a move below the $25,400 support zone.
Bitcoin Price Remains In Downtrend
Bitcoin price struggled to settle above the $26,500 resistance zone. BTC declined below the $26,150 support to move into a bearish zone.
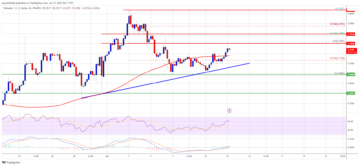
The recent high was formed near $26,133 and the price is now moving lower. There was a break below the 50% Fib retracement level of the upward move from the $25,400 swing low to the $26,133 high. The price also traded below the $25,750 support.
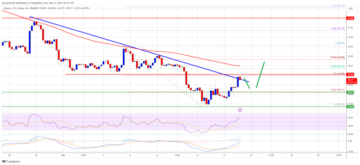
Bitcoin price is now trading below $26,000 and the 100 hourly Simple moving average. There is also a key bearish trend line forming with resistance near $26,000 on the hourly chart of the BTC/USD pair.
It seems to be holding the $25,570 support level. It is close to the 76.4% Fib retracement level of the upward move from the $25,400 swing low to the $26,133 high. Immediate resistance is near the $26,000 level and the trend line region.
The first major resistance is near the $26,150 level. A clear move above the $26,150 resistance might start a decent increase. The next major resistance is near the $26,500 level. A close above $26,500 might send the price further higher.
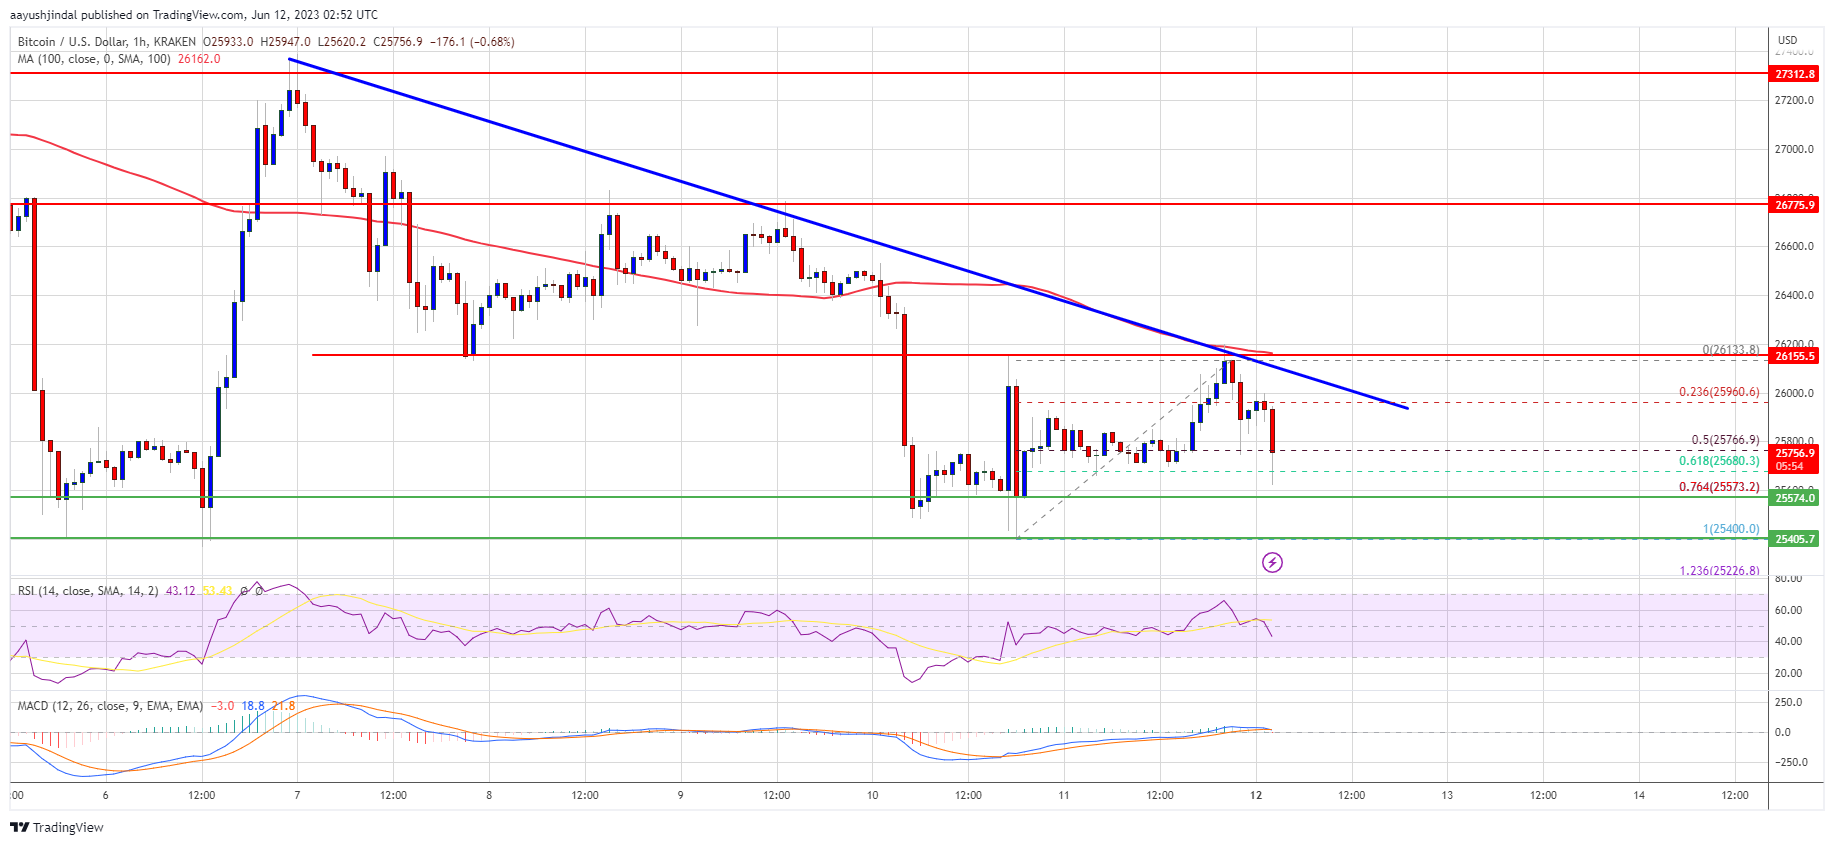
Source: BTCUSD on TradingView.com
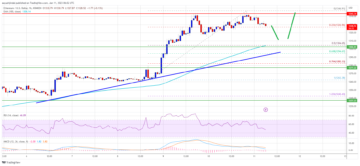
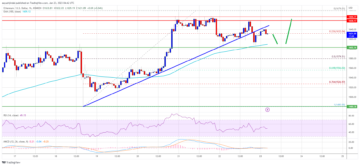
The next key resistance is near the $27,000 level, above which Bitcoin might rise toward the $27,500 resistance. Any more gains above the $27,500 resistance zone might send the price toward the $28,500 resistance zone.
More Losses in BTC?
If Bitcoin’s price fails to clear the $26,000 resistance, it could continue to move down. another decline. Immediate support on the downside is near the $25,570 level.
The next major support is near the $25,400 level, below which the price might accelerate lower. In the stated case, the price could drop toward the $25,000 support in the near term.
Technical indicators:
Hourly MACD – The MACD is now gaining pace in the bearish zone.
Hourly RSI (Relative Strength Index) – The RSI for BTC/USD is below the 50 level.
Major Support Levels – $25,570, followed by $25,500.
Major Resistance Levels – $26,000, $26,150, and $26,500.
- SEO Powered Content & PR Distribution. Get Amplified Today.
- EVM Finance. Unified Interface for Decentralized Finance. Access Here.
- Quantum Media Group. IR/PR Amplified. Access Here.
- PlatoAiStream. Web3 Data Intelligence. Knowledge Amplified. Access Here.
- Source: https://www.newsbtc.com/analysis/btc/bitcoin-price-at-significant-risk-25400/
- :is
- 000
- 100
- 50
- 500
- a
- above
- accelerate
- again
- also
- and
- Another
- any
- At
- average
- BE
- bearish
- below
- Bitcoin
- Bitcoin Price
- Break
- breaks
- BTC
- BTC/USD
- by
- case
- Chart
- clear
- Close
- continue
- could
- Crash
- data
- Decline
- down
- downside
- Drop
- fails
- First
- followed
- For
- formed
- from
- further
- gaining
- Gains
- High
- higher
- holding
- HTTPS
- if
- immediate
- in
- Increase
- index
- Indicators
- into
- IT
- Key
- key resistance
- Kraken
- Level
- levels
- Line
- losses
- Low
- lower
- MACD
- major
- max-width
- might
- more
- move
- moving
- moving average
- Near
- NewsBTC
- next
- now
- of
- on
- Pace
- pair
- plato
- Plato Data Intelligence
- PlatoData
- price
- recent
- region
- relative
- relative strength index
- remains
- Resistance
- retracement
- Rise
- Risk
- rsi
- seems
- send
- settle
- significant
- Simple
- start
- stated
- strength
- Struggling
- support
- support level
- support levels
- Swing
- term
- The
- There.
- to
- toward
- traded
- Trading
- TradingView
- Trend
- upward
- was
- which
- with
- zephyrnet