Bitcoin price extended its decline below the $28,000 support. BTC tested $27,650 and is currently attempting a minor upside correction.
- Bitcoin is showing bearish signs below the $28,500 resistance zone.
- The price is trading below $28,200 and the 100 hourly Simple moving average.
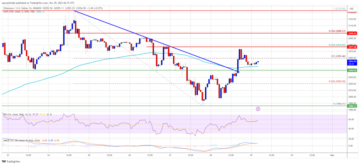
- There is a major bearish trend line forming with resistance near $28,000 on the hourly chart of the BTC/USD pair (data feed from Kraken).
- The pair could correct higher but upsides might be limited above the $28,500 level.
Bitcoin Price Extends Decline
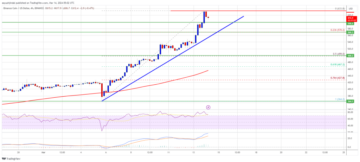
Bitcoin price failed to start a recovery wave above the $29,000 resistance zone. BTC extended its decline and traded below the $28,200 support zone.
The price even broke the $28,000 level and tested $27,650. A low is formed near $27,664 and the price is now consolidating losses. It is trading near the $28,000 resistance zone. There is also a major bearish trend line forming with resistance near $28,000 on the hourly chart of the BTC/USD pair.
Besides, Bitcoin is trading below $28,200 and the 100 hourly Simple moving average. Immediate resistance is near the $28,050 level. The next major resistance sits near the $28,200 zone and the 23.6% Fib retracement level of the downward move from the $29,975 swing high to the $27,664 low.
The first major resistance is near $28,500, above which the price may perhaps test the 50% Fib retracement level of the downward move from the $29,975 swing high to the $27,664 low.
Source: BTCUSD on TradingView.com
The main resistance is near $29,000 and the 100 hourly Simple moving average. A close above the $29,000 resistance could send Bitcoin toward $29,500. Any more gains could open the doors for a test of the key barrier at $30,000.
More Losses in BTC?
If Bitcoin’s price fails to clear the $28,200 resistance, it could continue to move down. Immediate support on the downside is near the $27,650 level.
The next major support is near the $27,200 zone, below which the price might dive toward the $26,500 support zone. Any more losses might take Bitcoin toward $25,500 in the near term.
Technical indicators:
Hourly MACD – The MACD is now gaining pace in the bearish zone.
Hourly RSI (Relative Strength Index) – The RSI for BTC/USD is now below the 40 level.
Major Support Levels – $27,650, followed by $27,200.
Major Resistance Levels – $28,200, $28,500, and $28,800.
- SEO Powered Content & PR Distribution. Get Amplified Today.
- PlatoAiStream. Web3 Data Intelligence. Knowledge Amplified. Access Here.
- Minting the Future w Adryenn Ashley. Access Here.
- Source: https://www.newsbtc.com/analysis/btc/bitcoin-price-slide-27650/
- :is
- 000
- 100
- 200
- 23
- 500
- a
- above
- also
- and
- any
- AS
- At
- attempting
- average
- barrier
- BE
- bearish
- bearish signs
- below
- Bitcoin
- Bitcoin Price
- Broke
- BTC
- BTC/USD
- but
- by
- Chart
- clear
- Close
- consolidating
- continue
- continues
- could
- crypto
- Crypto Market
- Crypto Market Sentiment
- Currently
- data
- Decline
- doors
- down
- downside
- downward
- Even
- Failed
- fails
- First
- followed
- For
- formed
- from
- gaining
- Gains
- High
- higher
- Hit
- HTTPS
- immediate
- in
- index
- Indicators
- IT
- ITS
- Key
- Kraken
- Level
- levels
- Limited
- Line
- losses
- Low
- MACD
- Main
- major
- Market
- market sentiment
- max-width
- May..
- might
- minor
- more
- move
- moving
- moving average
- Near
- NewsBTC
- next
- now
- of
- on
- open
- Pace
- perhaps
- plato
- Plato Data Intelligence
- PlatoData
- price
- recovery
- relative strength index
- Resistance
- retracement
- rsi
- send
- sentiment
- Signs
- Simple
- sits
- Slide
- start
- strength
- support
- support levels
- Swing
- Take
- takes
- term
- test
- The
- There.
- to
- toward
- traded
- Trading
- TradingView
- Trend
- Upside
- Wave
- which
- with
- zephyrnet