Bitcoin Price Prediction – February 9
Looking at the daily chart, the Bitcoin price prediction is showing positive signs, and it is likely to accelerate further higher in the near term.
BTC/USD Long-term Trend: Bearish (Daily Chart)
Key levels:
Resistance Levels: $50,000, $52,000, $54,000
Support Levels: $39,000, $37,000, $35,000

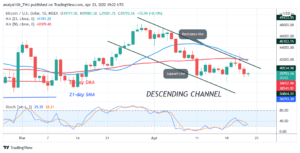
According to the daily chart, BTC/USD breaches $44,000 as the king coin is ready to break above the upper boundary of the channel. The first digital crypto is seen trading well above the 9-day and 21-day moving averages at $44,122. More so, the Bitcoin price is within touching distance of forming a new all-time high above the previous high of $45,519, which is quite remarkable.
Bitcoin Price Prediction: Bitcoin (BTC) Prepares for the Upside
According to the daily chart, the Bitcoin price is trading comfortably towards the upper boundary of the channel as the price establishes a new bullish signal. Like the look of things, one could say that the long-term outlook favors the bulls, giving the daily close produced a bullish candle with eyes now set on the daily resistances at $50,000, $52,000, and $54,000 respectively.
Furthermore, any drop from the current level could lead to critical supports below the 9-day moving average. In case BTC drops and touches the low of $40,000 support, then the coin can rely on the long-term support levels at $39,000, $37,000, and $35,000. Moreover, the technical indicator Relative Strength Index (14) is now moving above 64-level, suggesting more bullish signals.
BTC/USD Medium-term Trend: Bullish (4H Chart)
According to the 4-hour chart, the Bitcoin price is seen trading above the 9-day and 21-day moving averages at $44,010. However, today’s price move happens to be an impressive one as it climbs above the long-awaited resistance level of $44,000 with a sharp cross. More so, BTC/USD is now maintaining its bull-run above this level as the technical indicator Relative Strength Index (14) moves above 60-level.
However, BTC may take a downward move if the bulls failed to push the price higher and the coin may breach below the moving averages which could reach another support at $42,000 and below. Nevertheless, if the bulls find a decent resistance level around $45,000, the coin may continue the bullish movement towards the upper boundary of the channel to hit the resistance level of $46,000 and above.
Looking to buy or trade Bitcoin (BTC) now? Invest at eToro!
68% of retail investor accounts lose money when trading CFDs with this provider
Read more:
- 000
- accelerate
- Another
- around
- average
- bearish
- Bitcoin
- Bitcoin BTC
- Bitcoin Price
- Bitcoin price prediction
- breach
- breaches
- BTC
- BTC/USD
- Bullish
- Bulls
- buy
- Coin
- continue
- could
- critical
- crypto
- Current
- digital
- distance
- Drop
- First
- Giving
- High
- HTTPS
- index
- investor
- IT
- King
- lead
- Level
- levels
- money
- more
- move
- movement
- moves
- Near
- Outlook
- prediction
- price
- Price Prediction
- Produced
- retail
- set
- Signs
- So
- support
- Supports
- Technical
- time
- today’s
- trade
- Trading
- within