Bitcoin Price Prediction – February 26
Today, the Bitcoin price prediction loses traction after hitting $40,300; losses likely to continue in the near term.
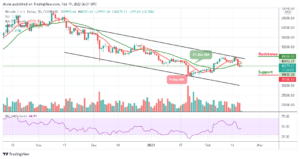
BTC/USD Long-term Trend: Bearish (Daily Chart)
Key levels:
Resistance Levels: $44,000, $46,000, $48,000
Support Levels: $35,000, $33,000, $31,000

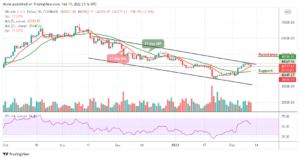
BTC/USD is retreating to cross below the 9-day moving average as the coin posts minor losses of 0.15% on the day after commencing the trading at $39,242. However, the market movement has an intraday high of $40,300; although the world’s largest crypto touches the support level of $38,592 before going back to where it is currently trading at $39,178.
Bitcoin Price Prediction: The Bitcoin Price May Plunge More
The Bitcoin price just plunged below $40,000 once again, marking $38,592 as the current daily low at the moment. Bitcoin (BTC) could be searching for a new low by crossing below the 9-day moving average. Looking at the declining daily volume candle, together with the steady but stable recent Bitcoin price action, it can be assumed that a stronger move may be coming up soon into the market.
At the time of writing, BTC/USD is struggling to maintain the $39,000 level, and if the coin follows the downward trend as the Relative Strength Index (14) remains below the 50-level, the next supports may likely come at $35,000, $33,000, and $31,000. On the contrary, if the coin crosses above the 21-day moving average, the further movement could go above the upper boundary of the ascending channel to hit the resistance levels of $44,000, $46,000, and $48,000 which could be well above the channel.
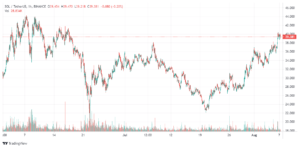
BTC/USD Medium-Term Trend: Ranging (4H Chart)
On the 4-Hour chart, BTC price hovers around the upper boundary of the channel at $39,301 which may take time to persistently trade above $40,000. However, should the bulls gather enough strength and stay above the 9-day and 21-day moving averages, the upward movement may come at the resistance level of $41,500 and above.

However, on the downside, immediate support is below the moving averages while the main support is at the $38,000 level. The price may likely fall to the support level of $37,000 and below. Technically, the Bitcoin price is still moving sideways while the Relative Strength Index (14) moves below 60-level, indicating an indecisive market movement.
Looking to buy or trade Bitcoin (BTC) now? Invest at eToro!
68% of retail investor accounts lose money when trading CFDs with this provider
Read more:
- 000
- Action
- Although
- around
- average
- bearish
- before
- Bitcoin
- Bitcoin BTC
- Bitcoin Price
- Bitcoin price prediction
- BTC
- btc price
- BTC/USD
- Bulls
- buy
- Coin
- coming
- continue
- could
- crypto
- Current
- daily
- day
- going
- High
- HTTPS
- index
- investor
- IT
- Level
- levels
- looking
- Market
- moment
- money
- more
- move
- movement
- moves
- moving
- Near
- Posts
- prediction
- price
- Price Prediction
- ranging
- retail
- Soon
- stay
- support
- support level
- Supports
- time
- together
- trade
- Trading
- volume
- world’s
- writing