Following green days, Bitcoin encountered resistance at $45K. Together with the negative momentum of the global markets, Bitcoin got heavily rejected and retraced below $42K.
Looking at the Stablecoin Supply Ratio, there is a substantial amount of ‘dry powder’ sitting aside, indicating the potential buying power. Meanwhile, the price action sees a pullback phase back to the latest crossed dynamic resistance level. All in all, this short-term correction is a healthy step for a reliable price recovery.
Technical Analysis
By: Shayan
Long-Term: The Daily Chart
Bitcoin has begun a mini-rally starting at $37.2K, with a series of solid daily green candles.
However, the bullish momentum has weakened. On Thursday, the price was rejected by the descending purple trendline along with the $45K resistance zone.
Currently, BTC is seeing a correction phase and is testing the crossed 50-day MA (~$42.2K), resembling a pullback pattern. Despite the latest correction, on the bigger picture and following a long-lasting bearish trend, BTC has finally made a higher high, increasing the chances of a trend reversal event.
Regardless, Bitcoin must establish a higher low during the ongoing corrective phase to complete the healthy reversal structure.

Short-Term: The 4-Hour Chart
The price charted a double-top pattern, which is a frequent bearish sign, after reaching its prior key pivot at the $45K resistance area. Two possible scenarios from now on:
- As mentioned before, the price will get rejected at resistance, deepen the correction, and drop to lower price levels to form a higher low.
- The price will get supported and break above the descending trendline, spike to higher levels and target the next key resistance around the $52K area.
Given the bearish double top pattern and diminishing bullish momentum, the first scenario seems more likely now.

Onchain Analysis
By: Edris
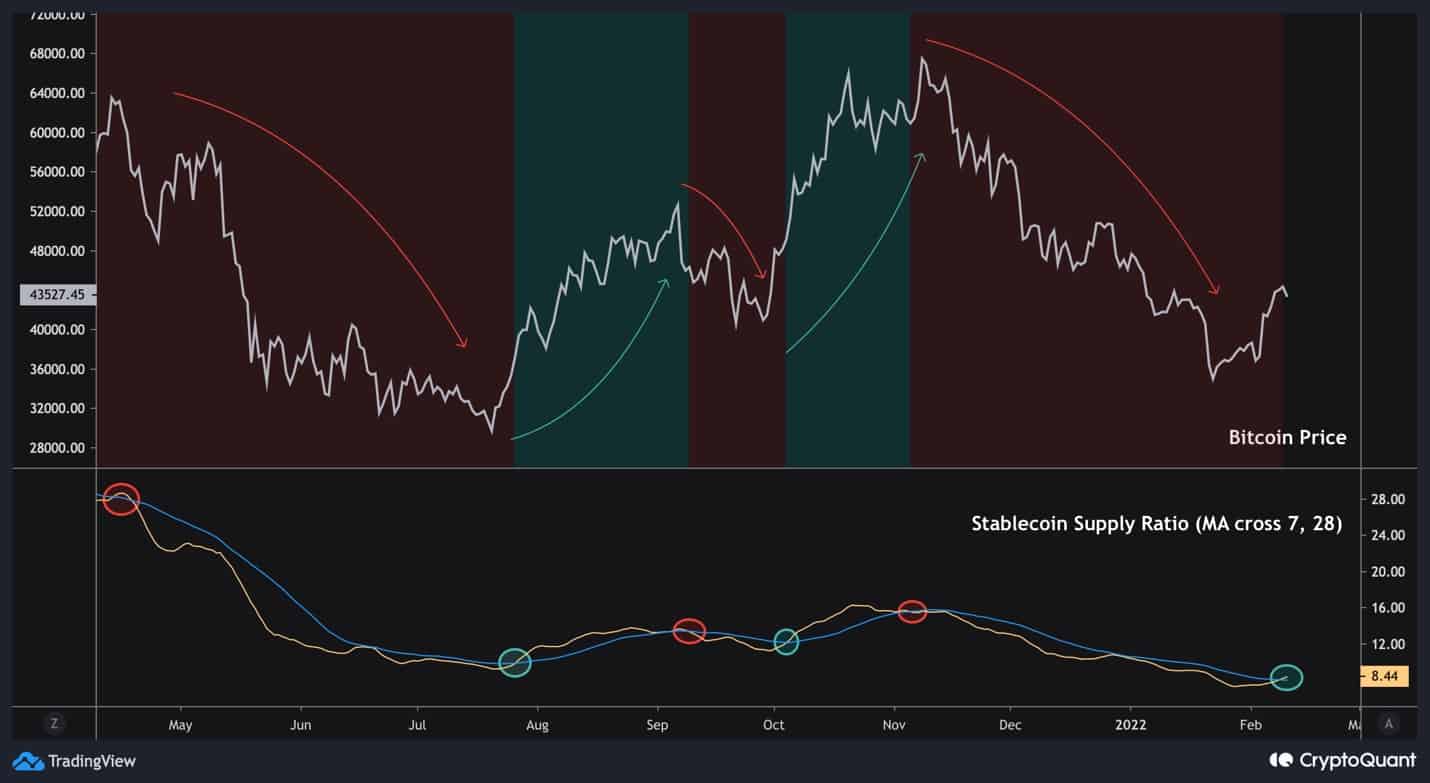
The following chart consists of bitcoin price (white), 7-day MA (yellow), and 28-day MA (blue) of Stablecoin Supply Ratio (SSR).
The SSR metric is calculated by dividing BTC’s market cap by the aggregated market cap of all stablecoins. SSR indicates when there is enough liquidity available to buy into the market or, on the other hand, when the buying power is not enough to move up the price, relative to BTC’s market cap.
Using the MA Cross indicator, potential bullish and bearish waves have been signaled with decent accuracy over the last year. Now, following a few months of correction (since November’s ATH), SSR MA Cross has finally painted a bullish signal, possibly indicating an end to this bearish leg.
Of course, this indicator should not be solely considered for decision-making, but it has been accurate over the past few months.
- 2K
- accurate
- Action
- All
- amount
- analysis
- AREA
- around
- available
- bearish
- Bitcoin
- Bitcoin Price
- Bitcoin Price Analysis
- BTC
- Bullish
- buy
- Buying
- chances
- Despite
- double
- Drop
- dynamic
- establish
- Event
- facing
- Finally
- First
- following
- form
- Global
- Green
- High
- HTTPS
- IT
- Key
- latest
- Level
- Liquidity
- Market
- Market Cap
- Markets
- Momentum
- months
- move
- Other
- Pattern
- phase
- picture
- Pivot
- possible
- power
- price
- Price Analysis
- recovery
- sees
- Series
- stablecoin
- Stablecoins
- substantial
- supply
- support
- Supported
- Target
- Technical
- Technical Analysis
- Testing
- together
- top
- waves
- year