Published 6 hours ago
The Hook token price witnessed a massive spike of 2000% minutes after it started trading on Binance’s innovation zone. However, following this tremendous jump, the coin price is currently in correction, trying to stabilize its gain.
advertisement
Key Points:
- The Hook price sustainability above $2.3 could assist buyers in surpassing the $2.6 barrier.
- A 4-hour candle closing below $2.15 will invalidate the bullish thesis and prolong the ongoing rally.
- The intraday trading volume in the Hook is $133.8 Million, indicating an 8% loss.
What Is Hook Protocol?
With its aim of massive Web3 adoption, the Hooked Protocol is building the on-ramp layer to form the ecosystem of future community-owned economies. They leverage the concept of Learn-to-Earn and other gamified programs to serve their purpose and assist even newcomers in the crypto space.
HOOK is the utility and governance token of the Hooked Protocol ecosystem and the primary mean for gas payments. Moreover, the Hooked Gold Token (HGT) serves as a crypto incentive token.
Hook Price Analysis In Hourly Chart
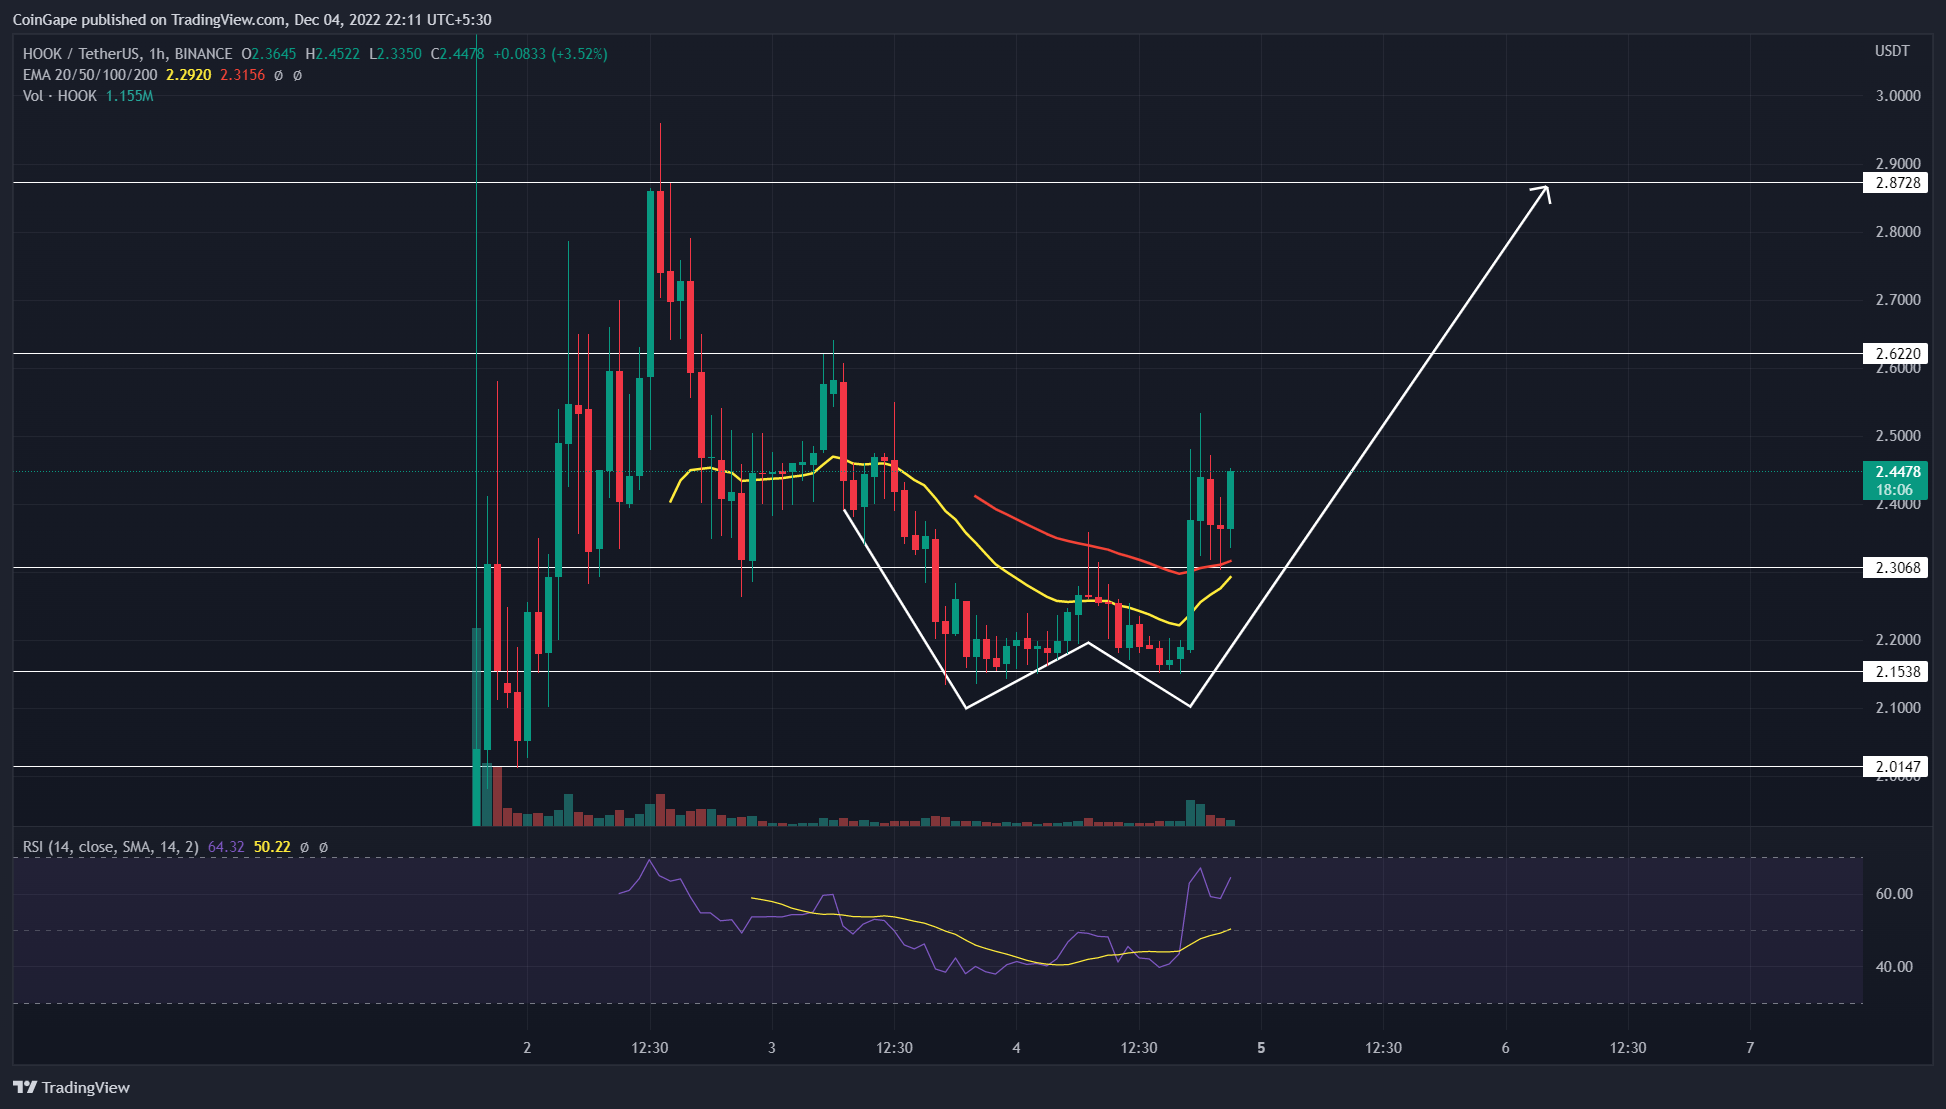
Source- Tradingview
Trending Stories
The launch of HOOK trading pairs on Binance significantly impacted its market value as it surged 20X over the initial token sale price. However, the hourly chart shows the prices formed a swing high resistance at $2.88 from where the token initiated its ongoing correction.
The bearish pullback tumbled the price 25.3% down to test the $2.15 mark as potential support. Furthermore, the HOOK token price rebounded twice from this support in the last two days, bolstering the formation of a double-bottom pattern.
In theory, this pattern reflects price sustainability above bottom support and triggers a directional rally upon the breakout of the resistance neckline. By press time, the token price traded at $2.39 and showed an 8.8% jump.
The bullish candle breached the $2.3 neckline resistance with increased volume to reflect buyers’ confidence to reach higher levels. Thus, the post-retest rally may drive the prices 21% higher to retest the $2.88 resistance.
Conversely, a breakdown below the $2.3 support will undermine the bullish pattern.
Technical Indicator
EMAs: the 20-and-50-day EMA wavering at the $2.3 mark, increasing the support power for this horizontal level.
advertisement
Relative Strength Index: The daily-RSI slope jump above the neutral line indicates the market participants share a bullish outlook for the Hook token.
Hook Token Intraday Price Levels
- Spot price: $2.39
- Trend: Bullish
- Volatility: High
- Resistance level- $2.62 and $2.87
- Support level- $2.3 and $2.15
Share this article on:
The presented content may include the personal opinion of the author and is subject to market condition. Do your market research before investing in cryptocurrencies. The author or the publication does not hold any responsibility for your personal financial loss.
- Bitcoin
- blockchain
- blockchain compliance
- blockchain conference
- coinbase
- Coingape
- coingenius
- Consensus
- crypto conference
- crypto mining
- cryptocurrency
- decentralized
- DeFi
- Digital Assets
- ethereum
- Hooked Protocol
- machine learning
- non fungible token
- plato
- plato ai
- Plato Data Intelligence
- Platoblockchain
- PlatoData
- platogaming
- Polygon
- Price Analysis
- proof of stake
- W3
- zephyrnet