- Bitcoin and Ethereum lag upward price action as selected altcoins carry on with the winning streak.
- Cardano makes hastes toward $2 ahead of the smart contracts functionality launch.
- The Graph closes the gap to $1 while a bullish MACD hints at a potential uplift to $1.2.
The cryptocurrency market is mainly painted red on Friday toward the end of the Asian session. Bitcoin has posted losses of more than 1.5%, accrued in the last 24 hours while exchanging hands marginally above $45,000. As reported, bulls are not giving up just yet and are ready to put up a fight for gains heading toward $50,000.
Meanwhile, Ethereum has lost over 3% of its value in the same period to trade slightly above $3,100. A recent break above $3,200 became unsustainable, delaying the expected breakout to $4,000. Most crypto assets are in the red as the week’s trading comes to an end. Perhaps the weekend session will yield as much as it did last week.
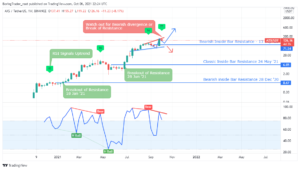
Cardano:-
Cardano is the investors’ darling this week following the announcement that the network will support the execution of smart contracts from Friday. The development comes after Ethereum completed the London hard fork last week, reducing gas fees for transactions and smart contract deployment.
When the news broke out early this week, Cardano surged massively and brushed shoulders with $1.8 for the first time since June. With the D-Day finally here, another upswing is undoubtedly in the cards. Investors are expected to celebrate the new development as speculation for gains to $2 and later the record high at $2.5 increase.
At the time of writing, Cardano is trading at $1.87 while bulls gaze at $2. The short-term technical picture adds credence to the bullish outlook, especially with the MACD moving higher above the mean line.
ADA/USD Daily Chart

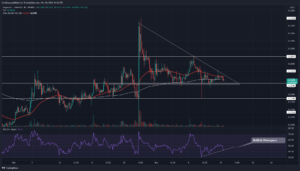
The Graph:-
The Graph is up with more than double-digits in 24 hours to trade at $0.92. The token has been on an upward roll since July, and the uptrend is still intact. Perhaps a break above the 100-day SMA kept investor interest high, while increased demand for the token only boosts the value.
Currently, the odds favor the bulls primarily from the MACD’s bullish impulse. This momentum index suggests that the slightest resistance path is upward. As long as the buy signal is sustained, The Graph’s bullish outlook will remain steady in the coming sessions.
GRT/USD Daily Chart

A break above the coveted $1 would likely bolster The Graph toward $1.2. Note that the RSI is entering the overbought region, thus reinforcing the bullish grip. Nonetheless, traders should be careful when trading overbought conditions because corrections are always in the offing.
Subscribe to our newsletter for free

- "
- 000
- 100
- 2021
- Action
- ADA/USD
- All
- Altcoins
- analysis
- Announcement
- Assets
- AUGUST
- Bitcoin
- breakout
- Bullish
- Bulls
- buy
- Cardano
- Carry On
- Coingape
- coming
- content
- contract
- contracts
- Corrections
- crypto
- crypto-assets
- cryptocurrencies
- cryptocurrency
- cryptocurrency market
- Demand
- Development
- DID
- Early
- ethereum
- execution
- Fees
- Finally
- financial
- First
- first time
- fork
- Friday
- gap
- GAS
- gas fees
- Giving
- hard fork
- here
- High
- hold
- HTTPS
- Increase
- index
- interest
- investing
- investor
- Investors
- IT
- July
- launch
- Line
- London
- Long
- MACD
- Market
- market research
- Momentum
- network
- news
- Newsletter
- Opinion
- Outlook
- picture
- price
- Price Analysis
- research
- Roll
- selected
- Share
- smart
- smart contract
- Smart Contracts
- support
- Technical
- The Graph
- time
- token
- trade
- Traders
- Trading
- Transactions
- value
- week
- weekend
- writing
- Yield