Two-dimensional culture of umbilical-cord-derived MSCs
MSCs from umbilical cord (ucMSCs) were obtained from the Anthony Nolan Cord Bank, cut in small pieces and plated in basal medium (that is, αMEM + 1% v/v penicillin–streptomycin) containing 5% (v/v) human platelet lysate at 37 °C, 5% CO2. After removal of non-adherent cells and washing with PBS, the media was replenished and the cells were cultured until reaching 70–90% confluency. Trypsinization was then performed for further characterization and cell passaging. ucMSCs were characterized for positivity of CD90, 105, CD106 and CD73, human leukocyte antigen class I, and the lack of expression of CD14, CD31 and CD45. Early passages of 1 × 10⁶ ucMSCs (passages 2–5) were continuously cultured in a filtered 175 cm2 flask (Corning) in basal media + 5% (v/v) human platelet lysate. When the cells reached 70%–80% confluency, the media were replaced with basal medium prior to harvesting CCM on the following day for EV isolation and subculturing by a conventional trypsinization protocol.
Three-dimensional culture of ucMSCs
Aggrewell400 microwell culture plate was used to generate ucMSC spheroids following a previously established protocol15. Briefly, 500 µl anti-adherence rinsing solution was added to each well prior to centrifugation at 2,000g for 2 min to remove bubbles and incubation for 30 min–2 h at room temperature. The Aggrewell was then washed with 500 µl PBS per well, followed by addition of 500 µl basal medium and centrifugation at 2,000g for 2 min to remove bubbles. The basal medium was then replaced with the cell suspension obtained from 2D trypsinization (prepared at a density of 1.2 × 10⁵ cells per 500 µl per well in the basal medium supplemented with 20% v/v KO serum replacement according to the manufacturer’s instructions). The plate was then centrifuged at 200g for 5 min for cell aggregation at the bottom of each microwell and kept undisturbed in the incubator. CCM was harvested on day 3 and every 2–3 days for EV isolation. Fresh medium was replenished after medium harvesting to maintain spherical ucMSC culture for 12 days.
Isolation of EVs
EV isolation was performed as described in detail previously46. Ultraclear polycarbonate ultracentrifuge tubes (catalogue number 355631, Beckman Coulter) were filled with 22.5 ml filtered CCM (prepared by filtering CCM using a 0.22 µm syringe filter). Then, 3 ml 25% w/w sucrose solution (prepared in D2O) was layered slowly below the CCM using a glass Pasteur pipette. Centrifugation using a swing-out rotor (SW32 Ti, Beckman Coulter) was performed at 100,000g for 1.5 h at 4 °C. The sucrose solution was then collected (2 ml per tube) and subjected to a washing step for EV purification by adding to prefilled polycarbonate ultracentrifuge tubes (catalogue number 355618; Beckman Coulter) with 20 ml filtered PBS prior to ultracentrifugation at 100,000g for 1.5 h at 4 °C using a fixed-angle rotor (70 Ti, Beckman Coulter). Supernatant was discarded and the pellet of EVs obtained was resuspended in filtered PBS. EVs were kept at 4 °C for 1 week storage and −80 °C for long-term storage.
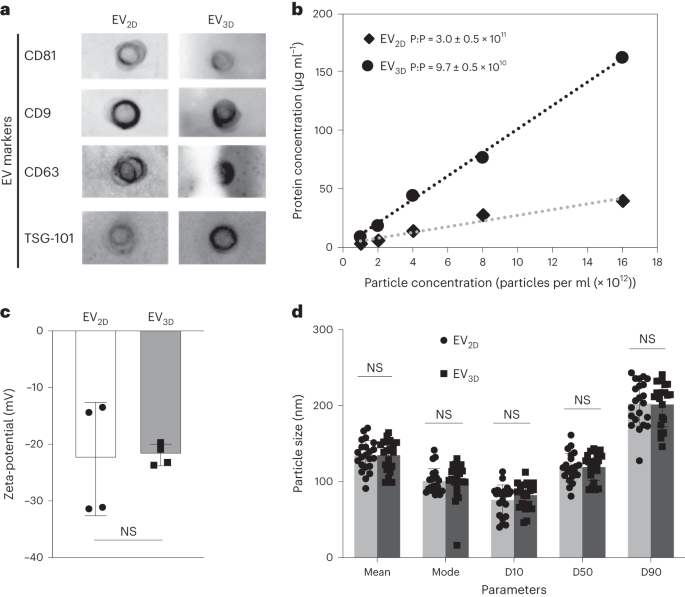
Detection of EV markers by dot-blot
The analysis was performed following a previously published protocol15. First, 50 µl EVs at a concentration of 5 × 10¹⁰ particles per ml were spotted on a nitrocellulose membrane (one membrane per marker) (Bio-Rad). The membrane was dried by nitrogen gas prior to the blocking step using blocking buffer (that is, 3% skim milk prepared in Tris-buffered saline with 0.1% Tween 20 (TBS-T)) for 1 h at room temperature. Primary antibodies (CD9, CD63, CD81 and TSG101) were individually added in fresh blocking buffer followed by incubation overnight at 4 °C (1:1,000 dilution). The membrane was then washed three times in TBS-T, 5 min each wash. Horseradish-peroxidase-conjugated secondary antibody was then added to the fresh blocking buffer prior to further incubation for 1 h at room temperature (1:20,000 for anti-mouse and 1:1,000 for anti-rabbit). The membrane was washed as previously mentioned, and the signals were developed by substrate addition (SuperSignal West Femto Maximum Sensitivity Substrate), followed by imaging using the Gel Doc system (Bio-Rad) and analysis by Image Lab software (Bio-Rad).
Protein assay for determining the protein concentration of isolated EVs
Protein concentrations were determined by microBCA assay in a 96-well plate following the manufacturer’s instructions adapted for EVs. Briefly, EV samples (minimum concentration, 5 × 10¹⁰ particles per ml) were diluted 1:1 in PBS. MicroBCA reagent mix (prepared according to the manufacturer’s instructions) was added to duplicate 40 µl diluted samples (50 µl per well), followed by incubating at 37 °C for 1 h. The measurement was compared against serially diluted BSA as standard (prepared in duplicates). The absorbance was read at 562 nm using a FLUOStar Omega plate reader (BMG LabTech). MARS v.2.40 software (BMG LabTech) was used for analysis by extrapolating the values from the standard curve using a third-order polynomial equation, with r2 > 0.999 for each assay.
NTA
The size and concentration of EVs was measured by NTA using a Nanosight LM10 (Malvern Instruments) equipped with a 488 nm laser. The camera level was automatically adjusted, and the analysis detection threshold was set at 3–4. EV samples were diluted in filtered PBS to obtain optimal concentrations (20–80 particles per frame). Four video recordings with a duration of 40 s were carried out for each EV preparation. Nanosight NTA 3.2 software (Malvern Instruments) was used to analyse the recorded video.
Zeta-potential
The dynamic electrophoretic mobility of EVs and HC-EVs was measured with a Malvern Zetasizer Nano ZS and Zetasizer v.7.12 software (Malvern Instruments). Prior to the measurements, EV samples (minimum concentration, 1 × 10¹¹ particles per ml) were diluted 1:50 in deionized water. Measurements were carried out at 25 °C for each experimental triplicate.
Protein corona preparation
Protein corona coating was performed following a published protocol47 with modifications. To remove EVs and aggregated protein serum, FBS was subjected to ultracentrifugation at 100,000g for 18 h at 4 °C. Supernatant was collected and filtered through 0.22 µm filters (EV-D FBS). EVs (∼7 × 10¹¹ particles, equivalent to 0.05 m2) were prepared in a total volume of 300 µl sterile PBS supplemented with 1% penicillin–streptomycin solution (sPBS-PS) in 1.5 ml Eppendorf tubes prior to incubating with 300 µl EV-D FBS for 1 h at 37 °C, 300 r.p.m. Upon incubation, the mixture was transferred to an ultracentrifuge tube (catalogue number 343778, Beckman Coulter). The samples were ultracentrifuged at 100,000g for for 1 h at 4 °C. Supernatant was carefully removed without disturbing the pellet. The pellet was further washed with 1 ml sPBS-PS twice, following the above-mentioned condition. In corona desorption studies, upon the final wash, the pellet (HC-EVs) was dispersed in freshly prepared 100 µl 2% w/v SDS, 62.5 mM Tris–HCl solution, followed by incubation at 95 °C for 5 min to desorb the proteins constituting the HC. The HC was then separated from EVs by ultracentrifugation as above. The supernatant containing HC was collected and subjected to protein determination by microBCA assay. HC solutions were stored at −80 °C before further analysis.
SDS–PAGE
EVs, HC-EVs, EV-D FBS, KO and HC (15 µg) samples were mixed with LDS sample buffer and RIPA buffer (mixed with 1:100 protease inhibitor cocktail) and incubated for 10 min at 70 °C. The samples were then applied on a NuPAGE 4–12% Bis–Tris protein gel and run for 30 min at 100 mV and a further 1 h at 150 mV. For silver staining, the gel was fixed in 100 ml fixing solution (50% methanol, 10% acetic acid, 50 µl formaldehyde) overnight, followed by washing with 50% ethanol three times. The gel was then sensitized by hypo-solution (0.02% w/v sodium thiosulfate) for 1 min, followed by impregnating the gel with 0.2% w/v silver nitrate for 30 min. The gel was then washed with deionized water three times and subjected to band development using 100 ml developing solution (6 g sodium carbonate, 2 ml hypo-solution and 50 µl formaldehyde). Once developed, the reaction was stopped by 5% v/v acetic acid. A digital photograph of the gel was taken against a white background.
Digestion of the protein corona for mass spectrometry analysis
Proteomic analysis of FBS proteins, EVs and their HC by LC–MS was conducted using the method described by Schottler et al.47. Briefly, SDS was removed from the samples by Pierce detergent removal columns, and 25 µg of each protein sample was precipitated by ProteoExtract protein precipitation kit following the manufacturer’s manual. The resulting protein pellets were resuspended in 0.1% RapiGest SF in 50 mM ammonium bicarbonate and incubated for 15 min at 80 °C. Dithiothreitol (final concentration, 5 mM) was added to reduce the proteins, and the mixture was incubated at 56 °C for 45 min. Iodoacetamide (final concentration, 15 mM) was then added, and the mixture further incubated in the dark for 1 h at room temperature. The protein samples were digested for 18 h at 37 °C by trypsin with an enzyme:protein ratio of 1:50 (w/w). The reaction was stopped by the addition of 2 μl hydrochloric acid. The digested peptides were diluted with 0.1% v/v formic acid in UPLC-MS grade water and spiked with 50 fmol μl−1 Hi3 Escherichia coli standard for absolute quantification.
In vitro cellular uptake of EVs and HC-EVs
EV2D and EV3D were labelled as per our published protocol48. Concentration in particles per ml were obtained by NTA as mentioned above. The fluorescence intensity of freshly prepared EVs (100 µl) was measured using a FLUOStar Optima plate reader (BMG Labtech), with excitation and emission wavelengths of 485 nm and 520 nm, respectively. When there is a difference in labelling efficiencies between the batches or EV types, samples were mixed with non-labelled EVs so that fluorescence intensity and particles numbers are comparable for the different samples. Phagocytic cells, that is, J774 and human-monocyte-derived macrophages, and non-phagocytic cells, that is, HepG2, were seeded at a density of 1.5 × 10⁵ cells per well in 24-well plates (Corning). After 24 h, the media were changed to serum-free media, and the cells were treated with labelled EV2D, HC-EV2D, EV3D and HC-EV3D of comparable fluorescence unit values and a dose of 2 × 10⁹ particles and incubated for 1 h, 4 h and 24 h. To evaluate the contribution of albumin-binding receptor in mediating the EV internalization, HepG2 cells were treated with BSA (12.5 mg ml−1), followed by the addition of DiD-labelled EV3D, for 24 h. Flow cytometry was performed on a BD FACSCalibur using BD FACStation v.6.0 software (BD Biosciences) on the detached cells by trypsin–EDTA 0.05%, washed and resuspended in 200 µl PBS. All samples were analysed using FlowJo v.10.7.2 (TreeStar/BD Bioscience). Cells were gated by their forward and side scatter. The uptake of EVs was evaluated by the MFI of Alexa Fluor 488. Fold change in MFI was calculated with respect to the relative MFI increase over untreated controls.
Animals
All animal experiments were performed in compliance with the UK Animals (Scientific Procedures) Act 1986 and the UK Home Office Code of Practice for the Housing and Care of Animals Used in Scientific Procedures (Home Office 1989). In vivo experimentation adhered to the project license approved by the King’s College London animal welfare and ethical review body (AWERB) and the UK Home Office (PBE6EB195 and PP8950634). Animal research and veterinary care was performed at Franklin-Wilkins Building, King’s College London under the protocol approved for this study by a Named Training and Competency Officer (Julie Keeble) and a Named Animal Care and Welfare Officer (Jayne Morgan). Female CD-1 mice (~25–35 g, 5 weeks old) were obtained from Charles River for in vivo biodistribution study. Male and female C57BL/6 mice (18–25 g, 6–8 weeks old) were obtained from Charles River for in vivo cellular uptake study. All mice were housed in a 12 h light/12 h dark cycle with the temperature maintained between 65 and 75 °F (∼18–23 °C) and ∼50% humidity. Both sexes were used in the study, complying with the recently published recommendations by the UK Medical Research Council for conducting research on animals.
In vivo biodistribution of EVs by fluorescence optical imaging
Filtered CCM was incubated with 1 µM fluorescent lipophilic tracer DiR (1,1-dioctadecyl-3,3,3,3-tetramethylindotricarbocyanine iodide) at room temperature for 1 h with agitation prior to EV isolation by sucrose cushion plus ultracentrifugation as described above to remove unbound dye. The experiment was performed in CD1 mice, randomly divided into groups. Freshly purified DiR-labelled EV2D and EV3D (2 × 10¹¹ particles in 200 µl) were injected intravenously via the tail vein. Control mice were injected with PBS only or PBS containing DiR. Isoflurane-sedated live mice were imaged using the IVIS Lumina III system (excitation, 740 nm; emission, 840 nm) at 1, 4 and 24 h following intravenous injection prior to killing the animals. Major organs (brain, heart, lung, liver, stomach, spleen, kidney and intestine) were harvested for ex vivo fluorescence imaging. The fluorescence intensity in each organ (total radiant efficiency) was obtained using Living Image v.4.7.3 Software (PerkinElmer) to determine the organ biodistribution of DiR-labelled EV2D and EV3D by drawing the regions of interest (ROIs) of each organ. The values were then normalized to organ weights (total radiant efficiency per g). For the renal clearance study, upon injection with DiR-labelled EVs, mice were individually housed in a standard circular metabolic cage (Nalgene Nunc) for 24 h, and urine was collected into a Nalgene tube at the bottom of a funnel system for further fluorescence intensity determination using an IVIS Lumina III system and Living Image v.4.7.3 Software (PerkinElmer) by drawing ROIs covering a urine container to obtain total radiant efficiency per urine sample.
In vivo cellular uptake of EVs in liver subpopulations
EV2D and EV3D were labelled with DiD (DiIC18(5); 1,1′-dioctadecyl-3,3,3′,3′-tetramethylindodicarbocyanine, 4-chloro-benzenesulfonate salt) using the same procedure as for DiR labelling in the in vivo studies. The experiment was performed in C57BL/6 mice, randomly divided into groups. Freshly purified DiD-labelled EV2D and EV3D (2 × 10¹¹ particles in 200 µl) were intravenously injected via the tail vein. Control mice were injected with PBS only or PBS containing DiD. For the albumin receptor blocking study, 100 µl BSA diluted in PBS (10 mg ml−1, dosage selected based on the literature49,50,51,52) was injected 5 min prior to EV3D injection (2 × 10¹¹ particles in 100 µl). For the study of albumin-coated EV internalization, to prepare albumin-coated, DiD-labelled EV2D, 2D ucMSCs (70–80% confluency) were cultured in basal medium supplemented with 2.5 mg ml−1 BSA, followed by medium collection after 24 h of culture, DiD labelling and EV isolation as previously mentioned. Albumin-coated DiD-labelled EV2D were then intravenously injected (2 × 10¹¹ particles in 200 µl). Twenty-four hours later, mice were anaesthetized with phenobarbital and subjected to skin dissection on the ventral midline to open the peritoneal cavity for liver perfusion following the previously published protocol with modifications53. Mice were perfused with 30 ml HBSS–EGTA warmed at 41 °C through the inferior vena cava using a peristaltic pump (SciQ 300, Watson Marlow) and a 27G × 0.38″ × 12″ winged infusion set (BD Valu-Set) at a speed of 15 r.p.m. The hepatic portal vein was cut after the liver became swollen and discoloured, after which the speed was adjusted to 20 r.p.m. Mice were then perfused with 25 ml collagenase-containing HBSS–CaCl2 (concentration, 1 mg ml−1) warmed at 41 °C, at a speed of 15 r.p.m. The liver was transferred to a Petri dish containing cold HBSS–CaCl2 buffer. Hepatic cells were released by gentle breaking of Glisson capsule and shaking the liver. Upon obtaining homogeneous cell suspension, cells were filtered through a 70 µm strainer (Corning). Hepatocytes were separated by centrifugation for 3 min at 50g at 4 °C with low brake, three spins. After each spin, the pellet was resuspended in 30 ml cold HBSS–CaCl2, and the supernatant was collected for further NPC fractionation. The NPC fraction was pelleted at 650g at 4 °C and subjected to incubation with RBC lysis buffer for 5 min on ice, followed by addition of 20 ml PBS to stop the reaction and further centrifugation at 650g at 4 °C to pellet the purified NPC fraction. The identification of each subpopulation was performed based on the marker expression using fluorescently labelled antibodies for analysis by flow cytometry (BD FACSCelesta, operated by BD FACSDiva v.9.2 software, BD Biosciences) and FlowJo v.10.7.2 software (TreeStar/BD Bioscience). Hepatocytes were stained with anti-mouse ASGPR1 antibody (1:200)54,55,56 and anti-human CD9 via intracellular staining using 0.1% Triton-X 100 in PBS. Kupffer cells were stained with anti-mouse CD45, F4-80 and CD11b (1:200, each)57,58,59. Endothelial cells were stained with anti-mouse CD45 (1:200), CD31 (1:200) and CD146 (1:100)60,61,62. Stellate cells were stained with anti-mouse CD45 (1:200), GFAP (1:50) and detected using a 450/50 filter and a 405 nm violet laser63,64,65. All fractions were stained with Zombie Aqua to determine the viability of the cells. Staining was performed for 30 min at room temperature. The frequency of parent cells taking up EVs was defined by gating the DiD-positive cell population against the control (PBS) group. The MFIs of the DiD signal expressed by each cell type were used to evaluate the uptake amount of EVs.
Statistical analysis
Statistical analyses of the data were performed using Prism 9.4.1 (GraphPad Software) by using one-way analysis of variance (ANOVA) with Tukey post hoc test for all P values (*P < 0.05, **P < 0.01, ***P < 0.001, ****P < 0.0001; P > 0.05 was non-significant). All results are expressed as mean ± s.d. Data distribution was assumed to be normal but this was not formally tested. No statistical methods were used to predetermine sample sizes, but the sample sizes were chosen based on previous experiments similarly performed by our group with proven statistically significant effects10. All graphs were made in Prism 9.4.1. MATLAB 9.11 was used to generate heatmaps of data. Data collection and analysis were not performed blind to the conditions of the experiments. All data points were included for analyses.
Reporting summary
Further information on research design is available in the Nature Portfolio Reporting Summary linked to this article.
- SEO Powered Content & PR Distribution. Get Amplified Today.
- PlatoData.Network Vertical Generative Ai. Empower Yourself. Access Here.
- PlatoAiStream. Web3 Intelligence. Knowledge Amplified. Access Here.
- PlatoESG. Carbon, CleanTech, Energy, Environment, Solar, Waste Management. Access Here.
- PlatoHealth. Biotech and Clinical Trials Intelligence. Access Here.
- Source: https://www.nature.com/articles/s41565-023-01585-y
- :is
- :not
- ][p
- $UP
- 000
- 001
- 01
- 05
- 1
- 10
- 100
- 11
- 12
- 15%
- 150
- 16
- 175
- 1996
- 2%
- 20
- 200
- 2000
- 2010
- 2011
- 2013
- 2015
- 2016
- 2017
- 2018
- 2019
- 2020
- 2021
- 22
- 24
- 25
- 2D
- 30
- 300
- 35%
- 4
- 40
- 41
- 45
- 46
- 48
- 5
- 50
- 500
- 52
- 54
- 58
- 6
- 62
- 65
- 7
- 70
- 75
- 80
- 89
- 9
- a
- above
- Absolute
- According
- accurately
- acquire
- Act
- adapted
- added
- adding
- addition
- adhered
- Adjusted
- administered
- After
- against
- aggregated
- aggregation
- AL
- Alexa
- All
- am
- amount
- an
- analyse
- analyses
- analysis
- Anchor
- and
- animal
- animals
- Anthony
- Antibodies
- antibody
- antigen
- applied
- approved
- aqua
- ARE
- article
- AS
- assumed
- At
- automatically
- available
- b
- background
- BAND
- Bank
- based
- BD
- BE
- became
- before
- below
- between
- biomarkers
- blind
- blocking
- body
- both
- Bottom
- Brain
- Breaking
- briefly
- BSA
- buffer
- Building
- but
- by
- calculated
- camera
- Cancer
- Cancer cells
- capable
- Capacity
- care
- carefully
- carried
- cell
- Cells
- cellular
- change
- changed
- characterized
- Charles
- chosen
- circular
- class
- clearance
- click
- cocktail
- code
- cold
- collected
- collection
- College
- Columns
- comparable
- compared
- compliance
- complying
- concentration
- condition
- conditions
- conducted
- conducting
- connolly
- Container
- continuously
- contribution
- control
- controls
- conventional
- cord
- Corona
- Council
- covering
- Culture
- curve
- Cut
- cycle
- Dark
- data
- data points
- day
- Days
- de
- defined
- delivery
- density
- dependent
- described
- Design
- detail
- detected
- Detection
- determination
- Determine
- determined
- determining
- developed
- developing
- Development
- DID
- difference
- different
- digital
- diluted
- dilution
- discarded
- dish
- dispersed
- distinct
- distribution
- divided
- DOE
- dosage
- dose
- drawing
- duplicates
- duration
- during
- dynamic
- dysfunction
- e
- E&T
- each
- Early
- effect
- effects
- efficiencies
- efficiency
- emission
- enabled
- enhanced
- Enhances
- equation
- equipped
- Equivalent
- established
- Ether (ETH)
- ethical
- EV
- evaluate
- evaluated
- evaluation
- Every
- evs
- experiment
- experimental
- experiments
- expressed
- expression
- female
- filled
- filter
- filtering
- filters
- final
- First
- fixed
- flow
- followed
- following
- For
- formaldehyde
- Formally
- formation
- Forward
- four
- fraction
- FRAME
- Frequency
- fresh
- from
- function
- functionally
- further
- GAS
- gated
- gating
- generate
- gentle
- glass
- grade
- graphs
- Group
- Group’s
- Harvesting
- Heart
- Home
- Home Office
- HOURS
- housing
- HTTPS
- human
- i
- ICE
- Identification
- identifies
- iii
- image
- Imaging
- immune
- immunity
- immunomodulatory
- in
- included
- Increase
- incubated
- Incubating
- INCUBATION
- incubator
- Individually
- induces
- inflammation
- inflammatory
- information
- infusion
- instructions
- instruments
- interaction
- interest
- into
- intravenous
- intravenously
- isolated
- isolation
- kept
- kidney
- killing
- kit
- lab
- labelling
- Lack
- lacking
- laser
- later
- layered
- Level
- License
- limits
- LINK
- linked
- live
- Liver
- living
- London
- long-term
- Low
- lumina
- macrophages
- made
- maintain
- maintained
- major
- male
- manual
- marker
- mars
- Mass
- material
- maximum
- mean
- measured
- measurement
- measurements
- Media
- medical
- medical research
- medium
- mentioned
- metabolic
- Methanol
- method
- methods
- methods Were
- mice
- migration
- Milk
- min
- minimum
- minor
- mix
- mixed
- mixture
- ML
- mobility
- Modifications
- MOL
- Morgan
- mouse
- Named
- nano
- nanotechnology
- Nature
- no
- normal
- number
- numbers
- obtain
- obtained
- obtaining
- of
- Office
- Officer
- Old
- on
- once
- ONE
- only
- open
- operated
- optical
- optimal
- or
- our
- out
- over
- overnight
- passages
- PBS
- per
- performed
- Petri
- phenotype
- pieces
- pierce
- plato
- Plato Data Intelligence
- PlatoData
- plus
- points
- polynomial
- population
- Portal
- portfolio
- Positivity
- Post
- practice
- preparation
- Prepare
- prepared
- previous
- previously
- primary
- Prior
- procedure
- procedures
- project
- proliferation
- promote
- protect
- Protective
- Protein
- Proteins
- protocol
- proven
- published
- pump
- quantification
- R
- Radiant
- ratio
- rbc
- reached
- reaching
- reaction
- Read
- Reader
- recently
- receptor
- recommendations
- recorded
- reduce
- reference
- reflect
- regions
- regulatory
- relative
- released
- removal
- remove
- Removed
- renal
- replaced
- replacement
- Reporting
- required
- research
- respect
- resulting
- Results
- reverting
- review
- River
- Room
- Run
- s
- salt
- same
- sample
- SCI
- scientific
- secondary
- selected
- selection
- Sensitivity
- Sepsis
- Serum
- set
- side
- Signal
- signals
- significant
- Silver
- Similarly
- single
- Size
- sizes
- skim
- Skin
- Slowly
- small
- So
- sodium
- Software
- solution
- Solutions
- speed
- Spin
- spins
- standard
- statistical
- statistically
- Stealth
- Stem
- stem cells
- Step
- Stop
- stopped
- storage
- stored
- studies
- Study
- substrate
- Surface
- suspension
- system
- T
- taken
- taking
- targeting
- test
- tested
- that
- The
- the UK
- their
- then
- There.
- this
- three
- three-dimensional
- threshold
- Through
- times
- to
- Total
- Tracer
- Training
- transferred
- treated
- Twice
- two
- type
- types
- Uk
- under
- unit
- until
- upon
- uptake
- used
- using
- Values
- veterinary
- via
- viability
- Video
- vivo
- volume
- was
- washing
- Water
- Watson
- wavelengths
- week
- Weeks
- Welfare
- WELL
- were
- West
- wheeler
- when
- which
- white
- with
- within
- without
- yields
- zephyrnet
- zombie