Ethereum price is attempting a recovery wave from the $1,835 zone against the US Dollar. ETH could start a steady increase if it clears the $1,860 resistance.
- Ethereum is trading in a range below the $1,860 and $1,880 resistance levels.
- The price is trading below $1,850 and the 100-hourly Simple Moving Average.
- There was a break below a short-term rising channel with support near $1,845 on the hourly chart of ETH/USD (data feed via Kraken).
- The pair could drop again if it stays below the $1,860 resistance.
Ethereum Price Turns Red
Ethereum’s price struggled to clear the $1,860 resistance zone and started a fresh decline. ETH settled below the $1,850 level to move into a bearish zone, similar to Bitcoin.
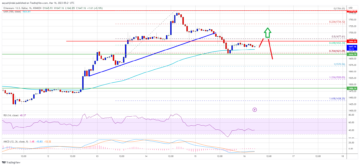
There was a break below a short-term rising channel with support near $1,845 on the hourly chart of ETH/USD. The pair tested the $1,830 zone. A low is formed near $1,833 and the price is now attempting a recovery wave. There was a move above the $1,840 level.
The price traded above the 23.6% Fib retracement level of the downward move from the $1,860 swing high to the $1,833 low. Ether is now trading below $1,850 and the 100-hourly Simple Moving Average.
On the upside, immediate resistance is near the $1,850 level. It is near the 50% Fib retracement level of the downward move from the $1,860 swing high to the $1,833 low. The first major resistance is near the $1,860 level. The next key resistance is near the $1,880 level.
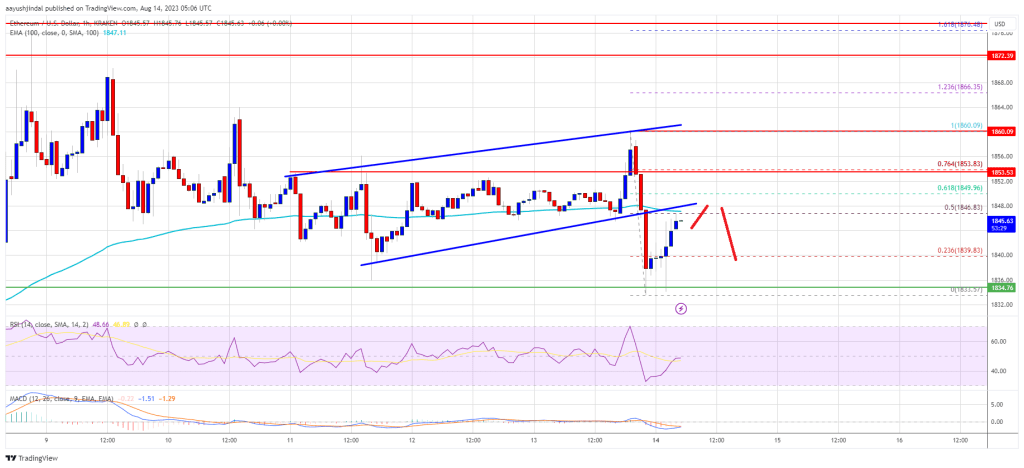
Source: ETHUSD on TradingView.com
A close above the $1,880 level could send the price toward $1,920. Any more gains might send the price toward the $2,000 hurdle, above which the price could rise toward the $2,040 level or even $2,120.
More Losses in ETH?
If Ethereum fails to clear the $1,860 resistance, it could continue to move down. Initial support on the downside is near the $1,835 level or the recent low.
The first major support is near the $1,820 zone. If the bulls fail to protect the $1,820 support, there could be a sharp decline. The next major support is near the $1,780 support level. Any more losses might send the price toward the $1,720 level in the near term.
Technical Indicators
Hourly MACD – The MACD for ETH/USD is losing momentum in the bearish zone.
Hourly RSI – The RSI for ETH/USD is now below the 50 level.
Major Support Level – $1,820
Major Resistance Level – $1,860
- SEO Powered Content & PR Distribution. Get Amplified Today.
- PlatoData.Network Vertical Generative Ai. Empower Yourself. Access Here.
- PlatoAiStream. Web3 Intelligence. Knowledge Amplified. Access Here.
- PlatoESG. Automotive / EVs, Carbon, CleanTech, Energy, Environment, Solar, Waste Management. Access Here.
- PlatoHealth. Biotech and Clinical Trials Intelligence. Access Here.
- ChartPrime. Elevate your Trading Game with ChartPrime. Access Here.
- BlockOffsets. Modernizing Environmental Offset Ownership. Access Here.
- Source: https://www.newsbtc.com/analysis/eth/ethereum-price-rebounds-1830/
- :is
- 000
- 1
- 23
- 50
- a
- above
- again
- against
- and
- any
- attempting
- average
- BE
- bearish
- below
- Break
- Bulls
- but
- Channel
- Chart
- clear
- Close
- continue
- could
- data
- Decline
- Dollar
- down
- downside
- downward
- Drop
- ETH
- ETH/USD
- Ether
- ethereum
- Ethereum Price
- Even
- FAIL
- fails
- First
- For
- formed
- fresh
- from
- Gains
- High
- HTTPS
- if
- immediate
- in
- Increase
- initial
- into
- IT
- Key
- key resistance
- Kraken
- Level
- levels
- Limited
- losing
- losses
- Low
- MACD
- major
- max-width
- might
- Momentum
- more
- move
- moving
- moving average
- Near
- NewsBTC
- next
- now
- of
- on
- or
- pair
- plato
- Plato Data Intelligence
- PlatoData
- price
- protect
- range
- recent
- recovery
- Resistance
- retracement
- Rise
- rising
- rsi
- send
- Settled
- sharp
- short-term
- similar
- Simple
- start
- started
- steady
- support
- support level
- Swing
- term
- tested
- The
- There.
- to
- toward
- traded
- Trading
- TradingView
- turns
- Upside
- us
- US Dollar
- via
- was
- Wave
- which
- why
- with
- zephyrnet