See the Supplementary Information for full details.
GO synthesis
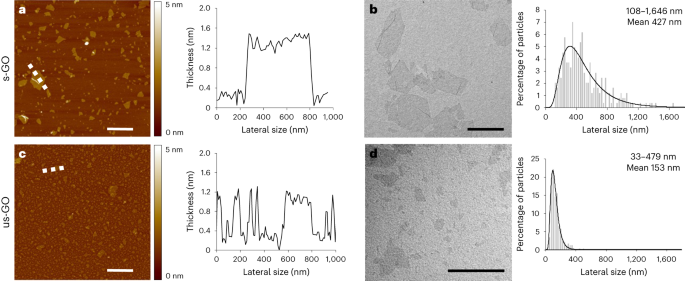
Aqueous dispersions of s-GO and us-GO were prepared as described in our previous studies6,45 by a modified Hummers’ method coupled with sonication. We used depyrogenized glassware, handled under endotoxin-free conditions. Graphite powder was mixed with sodium nitrate and sulfuric acid by rigorous stirring at low temperature, followed by potassium permanganate and dropwise addition of water for injections. The mixture was stirred for 30 min at 98 °C before the reaction was stopped with hydrogen peroxide. Water for injections was used to neutralize the pH, remove impurities and separate the GO from the graphitic residues. GO was exfoliated by vortexing, and solubilized with warm water for injections from the orange gel layer. Any graphitic residues still present in the dispersion were removed by an additional centrifugation step 24 h post-reaction. Size reduction to small and ultrasmall flakes was carried out by sonication for 5 min and 4 h, respectively.
Characterization of GO nanosheets
GO was comprehensively characterized by atomic force microscopy, transmission electron microscopy, hydrodynamic diameter and surface charge (zeta potential) measurements, UV–visible spectroscopy, fluorescence spectroscopy, Raman spectroscopy, Fourier transform infrared spectroscopy, thermogravimetric analysis and X-ray photoelectron spectroscopy (see the Supplementary Information for full details).
Nanoparticle exposure and characterization
Nanoparticles exposures were performed in a mobile exposure laboratory positioned outside the Royal Infirmary of Edinburgh (Supplementary Fig. 2), under the supervision of an experienced exposure technician. Stock suspensions of GO (2 mg ml−1 for s-GO; 1.3 mg ml−1 for us-GO) were made in sterile distilled water that was free of any bacterial contamination, confirmed using a previously published method10. s-GO was diluted to 1.3 mg/ ml−1 in sterile saline in aseptic conditions, aliquoted and stored at 4 °C until use.
GO was transferred to a 5 ml syringe, placed on the syringe pump and aerosolized using a Schlick compressed air nebulizer (model 970/S Untersiemau, Dusen-Schlick), with in-line diluted with HPLC-grade water. The compressed pre-heated (60 °C) airflow of the Schlick nebulizer was 12 l m−1. The aerosol was dried in a heated mixing glass tube, then diluted with HEPA-filtered room air to the desired concentration and humidified to 50–60% relative humidity using an ultrasonic nebulizer (Omron Ultrasonic Nebulizer NE-U12). The aerosol was fed into a 200 l mixing chamber and delivered to the volunteer by an exposure mask placed over the mouth and nose, under a constant temperature and relative humidity (50%). GO was delivered at exposure concentrations between 100 and 300 μg m−3, with a target average concentration of 200 μg m−3. This dose range was chosen based on our previous controlled exposure studies with dilute diesel exhaust, which were associated with impairment of a range of cardiovascular parameters without adverse effects19,30 and with carbon and gold nanoparticles that did not alter cardiovascular parameters29,46. The concentration could be adjusted by altering the speed of the syringe pump delivering the suspension based on tapered element oscillating microbalance (model 1400 A, Thermo Scientific) readings, monitored and maintained by the exposure technicians.
The particle concentration in the aerosol was measured in the middle of the 200 l mixing chamber by an stainless steel tube. The particle characteristics measured were: particle mass (tapered element oscillating microbalance, as well as by gravimetric filter based analyses), particle number (condensation particle counter, model 3022 A CPC, TSI Inc.) and particle size distribution (PALAS differential electrical mobility classifier (U-DEMC model 2200) and an optical particle sizer (model 3330,TSI Inc.)). The particle mass was also determined post-exposure by calculating the accumulated mass on pre-weighed telfon filters taken from the metal tubing close to the volunteer exposure mask.
Ethics statement
This study was designed with rigorous ethical review, with procedures being run by experienced clinicians and nursing support, and performed at a major hospital with the necessary emergency facilities should an adverse event have occurred. The study was performed in accordance with the Declaration of Helsinki, favourable ethical opinion of the University of Edinburgh, NHS Academic and Clinical Central Office for Research and Development (ACCORD), Research Ethics Committee (18-HV-084) and with written informed consent from all participants. The study has been registered on Clinicaltrials.gov under reference number NCT03659864.
Participants and eligibility criteria
Fifteen healthy volunteers were recruited by advertising the study by posters and e-mails in the hospital and university campus, as approved by local ethical review. The data from 14 participants were included as one participant was unable to complete the exposure visits in the time frame of the study. The target of 15 individuals was chosen according to our previous controlled exposure studies with air pollutants based on changes to vascular reactivity and inflammatory cytokines in the blood from diesel exhaust exposure due to a lack of other controlled exposure studies of a 2D material for comparisons. A 1 h exposure to diluted diesel exhaust produced an ~32% reduction in forearm blood flow to 1 nmol min−1 bradykinin (~16 ± 2 versus ~19 ± 2.5 ml per 100 ml tissue per min (±s.d.) for diesel exhaust versus filtered air control, respectively19. A 2 h exposure to diluted diesel exhaust produced a 12.5% increase in plasma TNF-α (0.99 ±;0.07 versus 0.88 ± 0.007 pg ml−1 (±s.d.) for diesel exhaust versus filtered air, respectively25. On the basis of these figures, 12 and 10 volunteers, respectively, would be needed to detect these changes with significance of P < 0.05 with an 80% power. As other studies have not tested the effects of an inhaled 2D material, as an additional precautionary step, the decision was taken to not increase group sizes beyond 15 for this initial study.
Interested participants were provided with a participant information sheet that they were asked to read and consider for at least 24 h before agreeing to be involved in the study. For study visits, participants abstained from alcohol for 24 h and from food and caffeine containing beverages for at least 12 h before the study visit. Participants were invited for an initial screening visit to ensure that they met the inclusion criteria (Supplementary Table 2). The participants were asked about their occupation on their screening visit to rule out obvious exposures to particulates. We did not ask participants to wear a face masks outside of the study visits, as low compliance would have added an additional source of variability between participants (the study was run before the coronavirus pandemic, before mask wearing became common in the United Kingdom), and even occupational face masks have been shown to vary greatly in their removal of inhaled particles during different modes of activity47. Importantly, each volunteer acted as their own control and received each exposure in a random order, minimizing variation from both intrinsic biology and lifestyle factors.
Study design
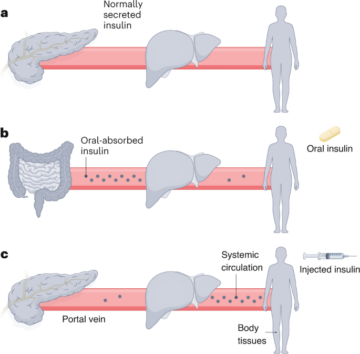
See Fig. 2. A screening visit was used to confirm eligibility criteria with the participant, followed by taking written consent and assignment of a participant code. Height, weight, heart rate, blood pressure and lung function were measured, and a 3 ml blood sample was taken for a full blood cell count. If parameters were within the normal range for young healthy individuals, participants were taken forwards to full study days. Participants also took a graded cardiorespiratory exercise stress test on a bicycle ergonometer to determine the workload required to generate a ventilation rate of 25 l min−1 m−2.
Two lateral dimensions of GO (maintaining all other physicochemical characteristics almost identical) were selected for the study: s-GO and us-GO. Both types of nanosheet have demonstrated no acute or longitudinal adverse effects in our previous pre-clinical (rodent) studies6, contrary to ‘large’ GO sheets that were thus excluded from this work as a safety precaution. A double-blind randomized crossover study design was used for the study visits, whereby the order of exposures (filtered air, s-GO, us-GO) were randomized. All study visits were organized at least 2 weeks apart to allow a wash-out period between different exposures. The volunteer and clinician performing the study were blinded to the identity of the exposure group. All researchers involved with collating and analysing the raw data were blinded to the exposure group, with unblinding occurring only when ready for grouping by exposure.
Before exposures (time t = 0 h), heart rate, blood pressure and lung function were measured, and blood taken. Participants were asked to empty their bladders and then given a urine container to collect any urine over the course of the study visit. Participants were then taken to the exposure laboratory based at the Royal Infirmary of Edinburgh site for the duration of the study. An experienced research clinician and exposure technician were present throughout the exposure, with the same researcher and nursing support present during the rest of the protocol.
In the exposure laboratory, participants wore a face mask through which nanoparticles could be delivered by inhalation. Volunteers were asked to cycle at the workload required to increase respiratory rate to 25 l min−1 m−2 (pre-determined by exercise testing at the screening visit) and rest alternately for 15 min periods across the 2 h exposure. After exposure, the subject returned to the Clinical Research Facility for assessment of biological parameters.
Vital signs, lung function and blood collected pre-exposure (t = 0 h), were repeated at t = 2.25, 4 and 6 h (that is, 15 min, 2 h and 4 h after exposure). For ease of reading, the 2.25 h time point is referred to as t = 2 h throughout). The ex vivo model of deep arterial injury was performed at 1–1.5 h post-exposure, and forearm plethsymography performed at 2–4 h post-exposure (see below). A light lunch was provided that was identical for all volunteers and all study visits. As an additional safety measure, a shortened protocol (without the ex vivo thrombosis assay, forearm plethysmography or 4 h measurements) was performed for the first exposure of each group. The study visits for the subsequent volunteers with the full protocol were scheduled only after it was confirmed that there were no adverse events and no marked changes in blood biomarkers. Volunteers were compensated for their time and travel expenses, which was approved by the ethics committee.
Lung function and vital signs
The participants were asked to rest in a sitting position for 15 min before measurement of vital signs and lung function. Lung function was measured by spirometry (Vitalograph Alpha III), with the optimal breathing techniques demonstrated at the screening visit. FEV1 and FVC were then measured, and a mean of two closely concurring consecutive runs were used. The participants were allowed to rest for a further 5 min before measurement of blood pressure and heart rate by sphygmomanometry.
Vascular function
The clinical protocol was designed to include measurement of vascular function in response to vasodilator drugs by venous occlusion plethysmography19 between t = 4 h and t = 6 h. However, due to technical and staffing difficulties we were unable to obtain reliable data from sufficient volunteers to make meaningful conclusions, thus the data were omitted. Further details of the technique can be found in the Supplementary Information.
Blood biomarkers
Blood was sampled before nanoparticle exposure (t = 0 h) and at 2, 4 and 6 h. A 17-gauge cannula was inserted into a large antecubital vein of both arms, and flushed with sterile saline. First, 1 ml of blood was discarded and approximately 27 ml was then collected for analysis. EDTA-treated blood was used for measurements of blood cell differentials, citrate-treated blood was used for coagulation markers (activated partial thromboplastin time, prothrombin time, fibrinogen) and clotted blood was used to collect serum for C-reactive protein (CRP) and cytokines (IL-6, TNF-α). Blood measurements were performed by the Clinical Biochemistry Unit at the NHS Royal Infirmary of Edinburgh by the standard methodology. Cytokines were measured using enzyme-linked immunosorbent assay (ELISA) (R&D Systems), with limits of detection of 0.022 pg ml−1 for TNF-α and 0.031 pg ml−1 for IL-6. Subsamples of blood and urine were frozen at −80 °C for biobanking.
Ex vivo thrombosis
The coagulability of blood was measured ex vivo using a model of thrombosis on deep arterial injury (Fig. 6). We have used this technique extensively in our clinical studies following exposure of volunteers to diesel exhaust30,48 and testing of antithrombotic medication49,50. Blood was withdrawn from an antecubital vein via a pump set at a flow rate of 10 ml min−1. The first 5 ml of blood was discarded before the cannula was connected using non-coagulation tubing (Masterflex Tygon, Cole Parmer) to three sequential cylindrical perfusion chambers maintained at 37 °C in a water bath. Strips of porcine aorta (Pel-freez) were prepared by carefully removing the intima and a thin layer of media to act as a thrombogenic substrate, and mounted in the chamber according to the physiological direction of blood flow. The rheological conditions in the first chamber simulated those of patent coronary arteries (low-shear rate, ~212 s−1), whereas those in the second and third chambers simulate those of mildly stenosed coronary arteries (high-shear rate, ~1,690 s−1). The model thus acts as one of deep coronary arterial injury. Each chamber run lasted for 5 min after which saline was perfused over the strip to remove non-adherent blood. The porcine strips with thrombus attached were removed and fixed in 4% paraformaldehyde. Strips were cut into eight cross-sections, wax-embedded, histologically sectioned and endogenous hydrogen peroxide activity blocked with 3% hydrogen peroxide solution. Sections were then incubated at room temperature for 1 h with polyclonal rabbit anti-human fibrin(ogen) antibody (1.2 μg ml−1; Cat. No. A0080, Dako) and monoclonal mouse anti-human CD61 antibody (1.28 μg ml−1; Cat. No. M0753, Dako). Antigen visualization was performed using a Bond Polymer refine detection kit (Leica Microsystems GmbH) and treatment with 3,3′-diaminobenzidine substrate chromogen (66 mM, Dako). Finally, sections were counterstained with haematoxylin followed by direct red 80 (0.1% sirius red). A semi-automated slide scanner (Axioscan Z1, Zeiss) and image analysis software (QuPath 0.2.3)51 were used by a blinded researcher to quantify thrombus area. High-resolution classifiers based on colour were established to detect total thrombus area.
High-fidelity nanoproteomics analysis of plasma samples
Preparation of liposomal nanoparticles and enrichment of plasma proteins
Hyrogenated soybean phosphatidylcholine (HSPC): Cholesterol (Chol):- 1,2-distearoyl-sn-glycero-3-phosphoethanolamine-polyethylene glycol2000 (DSPE-PEG2000) were prepared by thin lipid film hydration followed by extrusion, as previously described52. Lipids were dissolved in a 1:1 volume ratio of chloroform:methanol and evaporated under a vacuum. The lipid films were hydrated with ammonium sulfate to produce large multilammer liposomes. Small unilamellar liposomes were produced by extrusion through polycarbonate and extrusion filters (Whatman) using a mini-Extruder (Avanti Polar Lipids).
Liposomes and human plasma were incubated in an orbital shaker, and protein-coated liposomes were separated from excess plasma proteins following a previously described method53 using a two-step purification protocol that included size exclusion chromatography and membrane ultrafiltration. Bound proteins were mixed with S-trap lysis buffer containing 5% SDS triethylammonium bicarbonate to allow protein solubilization. Samples were reduced with dithiothreitol, and alkylated with iodoacetamide and dithiothreitol. Protein lysates were mixed with phosphoric acid and S-trap binding buffer to trap proteins in the columns, then digested with trypsin. Peptide samples were extracted and then desalted using oligo R3 beads. Samples were analysed by liquid chromatography mass spectrometry/mass spectrometry using an UltiMate 3000 Rapid Separation lipid chromatography platform (Dionex Corporation) coupled to a Q Exactive Hybrid Quadrupole-Orbitrap mass spectrometer (Thermo Fisher Scientific). The data analysis of the peptide samples is outlined in the Supplementary Information.
Eicosanoids and related bioactive lipid mediators
Targeted lipidomic analysis was undertaken using a panel of >50 eicosanoids that included prostaglandins (PGD2, PGE2, PGF2α, 13,14-dihydro-15-keto-PGD2, 13,14-dihydro-15-keto-PGE2, 11-beta-PGF2α, 6-keto-PGF1α, 15-deoxy-∆12,14-PGD2, 15-deoxy-∆12,14-PGJ2); thromboxanes (TxB2, 11-dehydro-TxB2); hydroxy-eicosatetraenoic acids (5-HETE, 8-HETE, 9-HETE, 11-HETE, 12-HETE, 15-HETE, 20-HETE); leukotrienes (LTB4, 20-carboxy-LTB4); epoxy-eicosatrienoic acids (5,6-EET, 8,9-EET, 11,12-EET, 14,15-EET; 5-OxoETE, 15-OxoETE); dihydroxy-eicosatrienoic acids (5,6-DHET, 8,9-DHET, 11,12-DHET, 14,15-DHET), hydroxy-eicosapentaenoics acids (5-HEPE, 15-HEPE), octadecadienoic acids (9-HODE; 13-HODE; 9-Oxo-ODE, 13-Oxo-ODE), epoxyoctadecamonoenoic acids (9,10-EpOME, 12,13-EpOME), pro-resolving mediators (lipoxin A4 – LXA4 and resolvins, RvD1, RvD2); isoprostanes (8-iso-PGF2α) and fatty acids (arachidonic acid, eicosapentaenoic acid (EPA), docosahexaenoic acid (DHA) and its metabolites, 7-HDHA; 14-HDHA; 17-HDHA; 10,17-DiHDHA).
Plasma was prepared from EDTA-treated blood. The following internal standards were used: PGE2-d4, 15-HETE-d8, LTB4-d4, 14,15- EET-d11, 14,15-dHET-d11, 9,10-EpOME-d4, 9,10-DiHOME-d4, RvD2-d5, EPA-d5 and 8-iso-PGF2α-d4 (Cayman Chemical). See the Supplementary Information for details of the processing of the samples. Eicosanoids were separated on a Hypersil GOLD C18 column (Thermo) using a Shimadzu Nexera-X2 ultra high performance liquid chromatography system. The effluent was directed into an IonTurbo source of a Sciex QTRAP 6500 mass spectrometer operated in negative-ion mode using multiple reaction monitoring. Eicosanoids were identified on the basis of their characteristic precursor/product ion pair transitions and matching retention time with authentic standards. Data were acquired and analysed using Sciex Analyst54 software v1.6. Concentrations of eicosanoids were determined by comparison to a calibration curve run in parallel for each compound and adjusted for recovery by reference to amounts of the appropriate internal standards.
General data and statistical analysis
Data were analysed using Excel 201055, R 3.2.2 (ref. 56) and Prism 9.3 (ref. 57). Data in Table 1 and Extended Data Tables 1–6 are presented as mean ± s.d., unless otherwise indicated. Continuous data are presented as means and s.d. Statistical significance within groups and between groups was tested using two-way analysis of variance with Tukey’s honest significant difference post hoc test. Parametric assumptions (normal distribution and equal variances) were confirmed using the statistical packages above; where data were not normally distributed a non-parametric alternative (for example, the Kruskal–Wallis test) was used.
Reporting summary
Further information on research design is available in the Nature Portfolio Reporting Summary linked to this article.
- SEO Powered Content & PR Distribution. Get Amplified Today.
- PlatoData.Network Vertical Generative Ai. Empower Yourself. Access Here.
- PlatoAiStream. Web3 Intelligence. Knowledge Amplified. Access Here.
- PlatoESG. Carbon, CleanTech, Energy, Environment, Solar, Waste Management. Access Here.
- PlatoHealth. Biotech and Clinical Trials Intelligence. Access Here.
- Source: https://www.nature.com/articles/s41565-023-01572-3
- :has
- :is
- :not
- :where
- ][p
- 05
- 07
- 1
- 1.3
- 10
- 100
- 11
- 12
- 13
- 14
- 15%
- 19
- 2%
- 200
- 2005
- 2008
- 2010
- 2011
- 2015
- 2016
- 2017
- 2018
- 2019
- 2020
- 2021
- 24
- 25
- 27
- 28
- 29
- 2D
- 30
- 300
- 3000
- 32
- 34
- 4
- 40
- 45
- 46
- 48
- 49
- 5
- 50
- 51
- 52
- 54
- 55
- 6
- 60
- 66
- 75
- 8
- 80
- 9
- 98
- a
- About
- above
- academic
- accord
- accordance
- According
- Accumulate
- Accumulated
- acquired
- across
- Act
- activated
- activity
- acts
- acute
- added
- addition
- Additional
- Adjusted
- adverse
- Advertising
- After
- against
- agreeing
- AIR
- Air pollution
- AL
- Alcohol
- All
- allow
- allowed
- almost
- Alpha
- also
- alternative
- am
- amounts
- an
- analyses
- analysing
- analysis
- analyst
- Anchor
- and
- antibody
- antigen
- any
- apart
- appropriate
- approved
- approximately
- ARE
- AREA
- arms
- around
- article
- AS
- ask
- asked
- assessment
- assignment
- associated
- assumptions
- At
- attached
- Authentic
- available
- Avanti
- average
- based
- basis
- BE
- became
- been
- before
- Beijing
- being
- below
- between
- Beverages
- Beyond
- binding
- biology
- biomarker
- biomarkers
- blocked
- blood
- Blood Pressure
- blueprint
- bond
- both
- bound
- breathing
- buffer
- by
- caffeine
- calculating
- Campus
- CAN
- carbon
- cardiovascular
- care
- carefully
- carried
- CAT
- causes
- Cayman
- cell
- central
- Chamber
- Changes
- characteristic
- characteristics
- characterized
- charge
- chemical
- chosen
- Circulation
- classifier
- click
- Clinical
- clinically
- clinicians
- Close
- closely
- code
- collect
- collected
- Column
- Columns
- combined
- committee
- Common
- comparison
- comparisons
- compensated
- complete
- compliance
- Compound
- computing
- concentration
- Conclusions
- conditions
- Confirm
- CONFIRMED
- connected
- consecutive
- consent
- Consider
- constant
- Container
- continuous
- contrary
- control
- controlled
- Core
- Corona
- Coronavirus
- Coronavirus pandemic
- CORPORATION
- could
- count
- Counter
- coupled
- course
- criteria
- curve
- Cut
- cycle
- cytokines
- data
- data analysis
- Days
- decision
- declaration
- deep
- delivered
- delivering
- demonstrated
- described
- Design
- designed
- desired
- details
- detect
- Detection
- Determine
- determined
- Development
- DID
- diesel
- difference
- different
- difficulties
- digital
- diluted
- dimensions
- direct
- directed
- direction
- discarded
- discovery
- Disease
- Dispersion
- distributed
- distribution
- dose
- Drugs
- due
- duration
- during
- dysfunction
- E&T
- each
- ease
- Edinburgh
- effectiveness
- effects
- eight
- element
- eligibility
- emergency
- empty
- Engine
- enrichment
- ensure
- Environment
- EPA
- equal
- established
- Ether (ETH)
- ethical
- ethics
- EUR
- Even
- Event
- events
- example
- Excel
- excess
- excluded
- Exercise
- expenses
- experienced
- Exposure
- expression
- extended
- extensively
- Face
- face mask
- face masks
- facilities
- Facility
- factor
- factors
- Fed
- Fig
- Figure
- Figures
- Film
- films
- filter
- filters
- Finally
- First
- fixed
- flow
- Flushed
- followed
- following
- food
- For
- Force
- formation
- found
- Foundation
- fourier
- FRAME
- Free
- from
- frozen
- full
- function
- further
- generate
- given
- glass
- GmBH
- Go
- Gold
- graded
- Graphene
- greatly
- Group
- Group’s
- guidelines
- handled
- Have
- healthy
- Heart
- height
- helsinki
- High
- high-resolution
- honest
- Hospital
- However
- HTTPS
- human
- Humans
- Hybrid
- hydration
- hydrogen
- identical
- identified
- Identity
- if
- iii
- image
- image analysis
- impairment
- importantly
- in
- Inc.
- include
- included
- inclusion
- Increase
- Increases
- incubated
- indicated
- individuals
- induces
- inflammatory
- information
- informed
- initial
- injections
- injury
- internal
- into
- intrinsic
- invited
- involved
- IT
- ITS
- Kingdom
- kit
- laboratory
- Lack
- language
- large
- layer
- least
- lifestyle
- light
- limits
- LINK
- linked
- Liquid
- local
- Low
- lunch
- made
- maintained
- maintaining
- major
- make
- man
- marked
- mask
- Masks
- Mass
- matching
- material
- materials
- mean
- meaningful
- means
- measure
- measured
- measurement
- measurements
- Media
- Men
- met
- metal
- Methanol
- method
- Methodology
- Microscopy
- Microsoft
- Microsoft Excel
- Middle
- Miller
- mills
- min
- minimizing
- mixed
- Mixing
- mixture
- ML
- Mobile
- mobility
- Mode
- model
- modes
- modified
- monitored
- monitoring
- monoclonal
- mouse
- mouth
- Mukherjee
- multiple
- nano
- nanotechnology
- Nature
- necessary
- needed
- NHS
- no
- normal
- normally
- nose
- number
- Nursing
- obtain
- obvious
- occupation
- occupational
- occurred
- occurring
- of
- Office
- on
- ONE
- only
- open
- open source
- operated
- Opinion
- optical
- optimal
- or
- Orange
- order
- Organized
- Other
- otherwise
- our
- out
- outlined
- outside
- over
- own
- packages
- pair
- pandemic
- panel
- Parallel
- parameters
- partial
- participant
- participants
- particle
- patent
- pathology
- per
- performance
- performed
- performing
- period
- periods
- placed
- Plasma
- platform
- plato
- Plato Data Intelligence
- PlatoData
- Point
- polar
- Pollution
- polymer
- portfolio
- position
- positioned
- Post
- posters
- potential
- power
- precaution
- prepared
- present
- presented
- pressure
- prevent
- previous
- previously
- procedures
- processing
- produce
- Produced
- Production
- protect
- Protein
- Proteins
- protocol
- provided
- published
- pump
- R
- R&D
- R3
- Rabbit
- random
- Randomized
- range
- rapid
- Rate
- ratio
- Raw
- raw data
- reaction
- Read
- Reading
- ready
- received
- receptor
- recovery
- Red
- Reduced
- reduction
- reference
- referred
- refine
- registered
- related
- relative
- reliable
- removal
- remove
- Removed
- removing
- repeated
- Reporting
- required
- research
- research and development
- researcher
- researchers
- residents
- respiratory
- response
- responses
- REST
- retention
- review
- rigorous
- Room
- royal
- Rule
- Run
- runs
- s
- Safety
- same
- sample
- scheduled
- SCI
- scientific
- screening
- Second
- Section
- sections
- see
- selected
- separate
- Serum
- set
- sheet
- sheets
- shortened
- should
- shown
- significance
- significant
- Signs
- simulate
- site
- Sites
- Sitting
- Size
- sizes
- Slide
- small
- sodium
- Software
- solution
- Source
- Sources
- Spectroscopy
- speed
- staffing
- Stainless Steel
- standard
- standards
- statistical
- steel
- Step
- Still
- stirring
- stock
- stopped
- stored
- stress
- Strip
- studies
- Study
- subject
- subsequent
- substrate
- sufficient
- supervision
- support
- Surface
- suspension
- Suspensions
- synthesis
- system
- Systems
- table
- taken
- taking
- Target
- team
- Technical
- technicians
- technique
- techniques
- test
- tested
- Testing
- that
- The
- the United Kingdom
- their
- then
- There.
- These
- they
- thin
- Third
- this
- those
- three
- Through
- throughout
- Thus
- time
- tissue
- to
- today
- took
- Total
- transferred
- Transform
- transitions
- transmission
- traps
- travel
- treatment
- two
- types
- ultimate
- Ultra
- Ultrasonic
- unable
- under
- unit
- United
- United Kingdom
- university
- unless
- until
- use
- used
- using
- v1
- Vacuum
- vary
- Versus
- via
- Visit
- Visits
- visualization
- vital
- vivo
- volume
- volunteer
- volunteers
- W
- warm
- was
- Water
- we
- wear
- Weeks
- weight
- WELL
- were
- when
- whereas
- which
- Wilson
- with
- withdrawn
- within
- without
- Work
- would
- written
- x-ray
- young
- zephyrnet
- Zeta