- Litecoin started a recovery wave above the $105 resistance against the US Dollar.
- LTC price is now trading above $105 and the 55 simple moving average (4-hours).
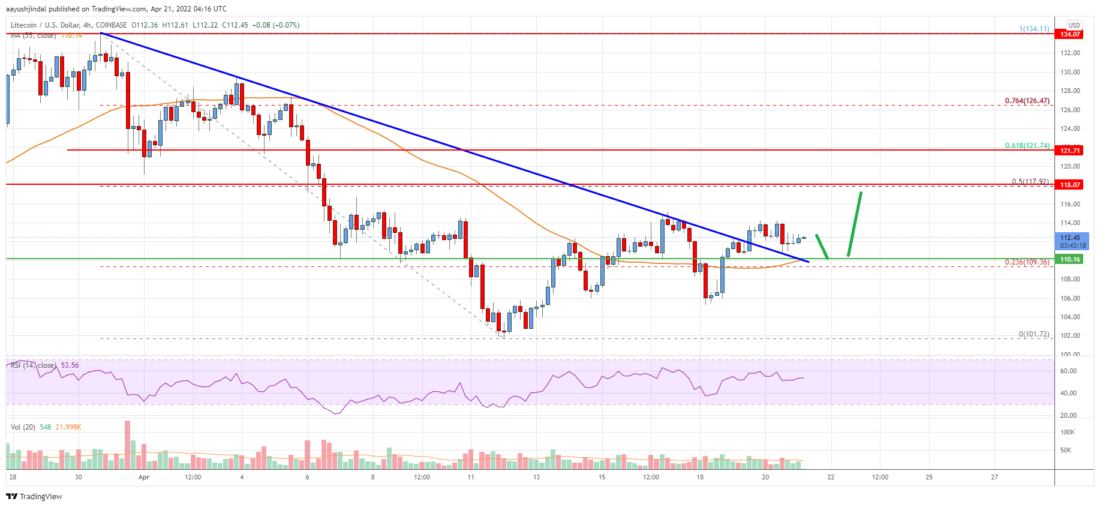
- There was a break above a major bearish trend line with resistance near $112 on the 4-hours chart of the LTC/USD pair (data feed from Coinbase).
- The pair could gain bullish momentum if it clears $115 and $118 in the near term.
Litecoin price is showing positive signs above $100 against the US Dollar, similar to bitcoin. LTC price could start a decent increase above the $115 level.
Litecoin Price Analysis
This week, there was a decent recovery in bitcoin, ethereum, ripple, and litecoin against the US Dollar. Earlier, LTC extended decline below the $110 support zone.
The price tested the $100 support zone and started a recovery wave. There was a move above the $105 resistance zone and the 55 simple moving average (4-hours). The price surpassed the 23.6% Fib retracement level of the key decline from the $134 swing high to $100 low.
Besides, there was a break above a major bearish trend line with resistance near $112 on the 4-hours chart of the LTC/USD pair. It is now consolidating near the $112 level. On the upside, an initial resistance is near the $115 level.
The first major resistance is near the $118 level. It is near the 50% Fib retracement level of the recent decline from the $130 swing high to $110 low. The main resistance is now forming near the $120 pivot level. To start a fresh increase, the price must clear $118 and $120. In the stated case, the price could rise towards $134. The next key resistance could be $142.
On the downside, an immediate support is near the $110 level. The next key support is near the $105 level. If there is a downside break below the $105 support, the price could continue to move down towards the $100 level.

Litecoin (LTC) Price
Looking at the chart, litecoin price is clearly trading above $105 and the 55 simple moving average (4-hours). Overall, the price could gain bullish momentum if it clears $115 and $118 in the near term.
Technical indicators
4 hours MACD – The MACD for LTC/USD is now gaining pace in the bullish zone.
4 hours RSI (Relative Strength Index) – The RSI for LTC/USD is now above the 50 level.
Key Support Levels – $110 and $100
Key Resistance Levels – $118 and $120.
The post Litecoin (LTC) Price Analysis: Bulls Target Bullish Move Above $120 appeared first on Live Bitcoin News.
- analysis
- average
- bearish
- Bitcoin
- Bullish
- Bulls
- coinbase
- continue
- could
- data
- Dollar
- down
- First
- fresh
- High
- HTTPS
- immediate
- Increase
- index
- IT
- Key
- Level
- Line
- Litecoin
- Litecoin (LTC)
- Litecoin price
- LTC
- LTC/USD
- major
- Momentum
- move
- moving
- Near
- Pivot
- positive
- price
- Price Analysis
- recovery
- Signs
- similar
- Simple
- start
- started
- stated
- support
- Target
- towards
- Trading
- us
- US Dollar
- Wave
- week